If you are a trader or stock investor looking into price action tools, at some point you will need to know what is the ADX. How does it work and what can it show me.
The ADX stands for the Average Directional Index. The term itself is potentially misleading as the ADX itself is non-directional. The ADX is a number between 0 and 100 that represents the strength of a price trend, whether that trend is up or down.
The ADX is often referred to as the trend strength indicator. Turning that phrase around means it should be used to assess the strength of a price movement trend.
How is the ADX derived?
The ADX is derived from two Directional Indicators, the +DI and the -DI, which themselves are derived from positive and negative indicators of directional movement, the +DM, and the -DM.
The ADX is usually displayed as a system of three lines, the ADX itself, the +DI, and the -DI. All three lines are usually 14-day smoothed moving averages and all three together are often referred to as the Directional Movement Indicator.
Calculation of the Directional Movement Indicators,+DM, -DM
The +DM and the -DM are both calculated from the difference between two consecutive price highs, and two consecutive price lows.
If the current high is lower than the previous high then the +DM is zero. If the current low is higher than the previous low then the -DM is zero. As far as this indicator is concerned, there are four kinds of price movements captured. This is best seen with a diagram.

Plus DM – The Directional Movement is positive, the current high $105 minus the previous high $103, i.e. $2 is greater than the previous low $97 minus the current low $98, i.e. $1. +DM is equal to the current high minus the previous high, i.e. +DM = 2 and -DM = 0
Minus DM – The Directional Movement is negative, the previous low $99 minus the current low $96, i.e. $3 is greater than the current high $102 minus the previous high $103 i.e. $1. -DM is equal to the previous low minus the current low i.e. -DM = 3 and +DM = 0.
Outside movement. When the high goes higher and the low goes lower, the price range is expanding. The greater of the differences between the two highs and the two lows determines whether +DM or -DM wins. In the example above the difference between the lows is greater. +DM = 0 and -DM = 2.
Inside movement. This is when the price is making lower highs and higher lows. This is also called a period of price contraction. Irrespective of the comparative magnitudes of the differences between the consecutive highs and the consecutive lows, when the price is contracting it is considered that there is no directional movement and both +DM and -DM = 0.
Calculating the ADX
The +DM and -DM make two sequences of numbers. The + Directional Indicator and the – Directional Indicator are derived as smoothed moving averages of +Directional Movement and – Directional Movement adjusted by a number called the Average True Range. The Average True Range is itself a smoothed moving average of the True Range.
The True Range for each period, which is typically one day, is the larger in each case of the absolute values of:
- The difference between the current high and the current low
- The difference between the current high and the previous close
- The difference between the current low and the previous close
The ADX and all the component elements, +DM, -DM, +DI, -DI, True Range, and Average True Range usually use daily prices and 14 day smoothed moving averages.
So what does the ADX show?
Now that we have plodded through much of the detail of what lies behind the ADX let’s look at what it shows.
Going back to our definition, the ADX itself shows the strength of a price trend but not the direction. As already noted, ADX is a number between 0 and 100. The closer the ADX is to zero, the weaker is the price trend. The larger is the numerical value of the ADX the stronger is the price trend.
The price direction is given by the two-directional indicators, +DI and -DI. When +DI is greater than -DI then the general price trend is bullish. When -DI is greater than +DI then the general price trend is bearish.
The ADX and the Directional Movement Indicator system was developed by J. Welles Wilder and first published in his book, New Concepts in Technical Trading Systems.
How the whole ADX and DMI system works
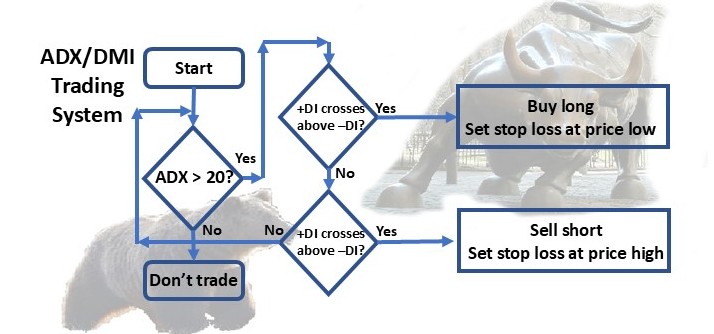
Putting all this together, the ADX and DMI system can be used to spot trading opportunities in a particular stock, currency pair, or commodity as follows.
- If the ADX is below 20 there is no trend so no trade opportunity
- If the ADX is above 25 (many traders use 20 today) there is a trend and potentially a trade opportunity
For a long trade
- If the +DI moves above the -DI and the ADX is above 25 (or 20) then open a long position
- Use the price low for the day as the initial stop loss.
- If the ADX drops and/or the +DI drops below the -DI wait until the position is stopped out.
- If the ADX stays above 25 (or 20) and the +DI stays above the -DI the price should trend upwards, move a trailing stop up and take profit when the ADX weakens or when the price hits your trailing stop.
For a short trade
- If the -DI moves above the +DI and the ADX is above 25 (or 20) then open a short position
- Use the price high for the day as the initial stop loss.
- If the ADX drops and/or the -DI drops below the +DI wait until the position is stopped out.
- If the ADX stays above 25 (or 20) and the -DI stays above the +DI then the price should trend downwards, move a trailing stop down and take profit when the ADX weakens or when the price hits your trailing stop.
And here is what that looks like as a flowchart.

ADX/DMI in action
So much for theory.
It’s time to have a look at how the ADX/DMI system performs under some familiar price movements. Here is how the price of the Standard and Poor’s 500 Index tracking fund from SPDR, symbol SPY behaved between early February and mid-April 2020 with the ADX/DMI shown underneath.

Source: PowerE*Trade
This was a period of strong price movement. The SPY, tracking the Standard and Poor’s 500 index had reached an all-time high of $329.08 on 19 February after a long bull market of a few years. Then the price dropped precipitously to a low of $218.26 on 23 March after which the price started to climb back again.
The ADX/DMI combination gave the following signals during this period
- A buy signal on 4 February at $328.62
- A sell signal on 20 February at $335.59
- A buy signal on 7 April at $270.54
ADX/DMI and the MACD
Let’s compare what buy and sell signals the Moving Average Convergence Divergence indicator or, MACD for short gave for SPY for the same period.
This article gives a detailed explanation of how the MACD works and generates buy and sell signals.
Here is what the SPY price, the ADX/DMI, and MACD look like for that period.

Source: PowerE*Trade
In this period the MACD generated two clear signals
- A sell signal on 21 February at $334.43
- A buy signal on 26 March at $256.61
ADX/DMI, the MACD, and the RSI
Making another comparison, let’s look now at the Relative Strength Indicator or RSI for short and what indications that gave for the same price chart.
The RSI was also an indicator developed by J Welles Wilder and published in the same book, New Concepts in Technical Trading Systems.
This article gives a more detailed look at the RSI.
This is what the SPY price, the ADX/DMI, the MACD, and the RSI look like on that same price chart.

Source: PowerE*Trade
In this period the indications from the RSI were not really very helpful. Not shown on the chart, the RSI was indicating that the SPY was overbought in late January. However, it also indicated that the SPY was oversold around 25 February.
If you had followed just the RSI and bought the SPY on 25 February you would have entered at around $329.79. You would not have been a very happy camper when the price continued to tumble down to a low of $218.26 a month later.
Comparing the signals
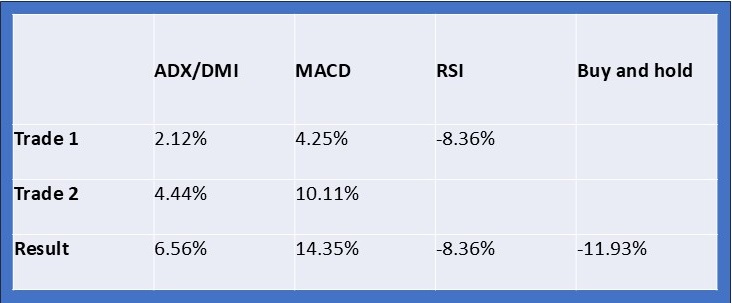
Just considering the price movement of the SPY for the period 1 February to 14 April 2020, this is what would have happened if we had followed signals from these systems, assuming that where relevant we started with a long position.
The first signal from the ADX/DMI would have us buy in at $328.62, then sell at $335.59 that would be a gain of 2.12%, then buy again at $270.54 if we assume that we closed out at the end of the period on 14 April at $282.55 that would have been another gain of 4.44%. This equates to a gain over the period of 6.56%
If we assume that we already held a long position at the beginning of the period we would have bought in at $320.81. The MACD would have us exit that position at $334.43 so a gain of 4.25%. The MACD would have us buy back in at $256.61. Again if we assume that we held to the end and closed on 14 April at $282.55 that would have been another gain of 10.11%. This equates to a gain over the period of 14.35%
In contrast, the RSI gave a sell signal late in January and if we had been following only that indicator we would not have been invested in SPY at the start of the period. The RSI gave a buy signal on 26 February. Following that signal, we would have bought at $308.32. Assuming that we held that position until 14 April when the price reaches $282.55. So that would have been a loss of 8.36%
For comparison, the SPY price over the whole period started at $320.81 and ended at $282.55. So that was a loss of 11.93% which is the loss we would have experienced had we adopted a simple buy and hold strategy. Here is a comparison of the results.
What we conclude from this
This was a very limited test drive of the ADX/DMI and comparable trading systems. In this example, both the ADX/DMI and the MACD outperformed a basic buy and hold approach fairly well while the RSI gave a marginal improvement. However, it would be a mistake to draw too many conclusions from this very limited test.
Best conditions for the ADX/DMI
The ADX/DMI system works best with volatile price movement. The system is often used for Forex and commodities trading. It can be used for stocks as long as there is a degree of volatility. J Welles Wilder measured volatility through the Average Trading Range which was a part of his ADX/DMI system. Price volatility is needed for the ADX/DMI system to generate clear signals.
This article gives more detail and background on the ADX/DMI system.
Answers to some questions about the ADX
Q Is the ADX a good indicator?
A. The ADX is a good indicator as long as it is used in conjunction with other indicators. The ADX is a number from 0 to 100 and only tells you the strength of a price trend not the direction of the trend. The ADX can be used with the plus and minus Directional Indicators. When the ADX is above 20 and the +DI crosses above the -DI that is an indicator of bullish price movement and a buy signal. When the ADX is above 20 and the -DI crosses above the +DI that is an indicator of bearish price movement and a sell signal. The ADX and + and – DI work best with volatile stocks, commodities, or currency pairs.
Q How is the ADX indicator calculated?
A. The ADX is calculated from a comparison of the difference between the current price high and the previous price high with the difference between the current price low and the previous price low. The ADX usually uses smoothed 14-day moving averages.
Q What is the meaning of the ADX indicator?
A. ADX stands for Average Directional Index. It shows the strength but not the direction of a price trend.
Q Which indicator works best with the ADX?
A. The best indicators to use with the ADX are the plus Directional Indicator and minus Directional Indicator. Much has been written saying that the ADX works best with the RSI. This article demonstrated that the RSI does not always give reliable buy and sell signals on its own.
Here is a single-page PDF summary of the ADX/DMI.

I hope you found this article interesting and useful. Do leave me a comment, a question, an opinion, or a suggestion and I will reply soonest. And if you are inclined to do me a favor, scroll down a bit and click on one of the social media buttons and share it with your friends. They may just thank you for it.
Disclaimer: I am not a financial professional. All the information on this website and in this article is for information purposes only and should not be taken as investment advice, good or bad.
Affiliate Disclosure: This article contains affiliate links. If you click on a link and buy something, I may receive a commission. You will pay no more so please go ahead and feel free to make a purchase. Thank you!
Hi Andy,
I am a stock investor and have often used ADX to some extent. However, you have revealed some startling new points which merit consideration. The main one is to use ADX in conjunction with DMI to spot opportunities in trading, especially in a particular stock.
ADX stands for Average Directional Index. It shows the strength but not the direction of a price trend. And that s the most important issue when deciding whether to buy or sell.
Thanks
Hi Aparna and thanks for the comment. I am also a stock investor. I must admit I tend to use the MACD more often than the ADX but after doing this analysis I will be giving it more attention. There is obviously an inherent risk in using a trading system that has been around for 40 plus years now and that is so well written about and frequently used. The more people use the same strategy and tools the less effective they become. Thanks again for your comment. Best regards, Andy
Hi Andy,
Thank you for sharing this knowledge to us.
We are beginner when it comes to investing in stock market. We understand the basic “Main Rules” – Basically, when the +Di line is above the -Di line you should be long and when the +Di line is below the -Di line you should be short.
After reading your post, we gain more information rather than just basic rules. Thank you…
All the best,
Kalle & Marie
Hi and thanks for stopping by and leaving your comment. I am glad you found it informative. Best regards, Andy
Hello there, ADX values help traders identify the strongest and most profitable trends to trade. The values are also important for choosing between trending and non-trending transaction. Many traders will use ADX readings above 25 to suggest that the trend is strong enough for trend-trading strategies. Thanks for sharing this awesome article.
Hi and thanks for your comment. Yes, the threshold that all of these indicators are set to is often one of the most important factors in avoiding false-positive i.e. trade signals that turn out not so good and on the other hand missed trading opportunities. Thanks again for your comment. Best regards, Andy
Hello there! great job you have done in this review as its very sincere and understandable by anyone who come across it. I totally agree with everything you have said here. In contribution to everything you have said; The ADX indicator works
best when used in combination with other technical indicators. The best ADX strategy also incorporates the RSI indicator in order to time the market. Thanks!
Hi and thanks for the comment. I am glad you found it easy to follow. Thanks again for the positive comment. Best regards, Andy
Unfortunately for me, I don’t do so much trading. I just started learning and I do not think that I can call myself a professional at that so this one might not be for me. Anyways, I think that the adx is a good one, and day traders should give it a go. I want to ask if this is also good for options trading
Hi and thanks for the comment. The ADX is equally valid for stock and options trading. I have a high proportion of my portfolio in options and it is a bit of a wild ride at times but as long as risks are well managed the rewards are potentially higher and it is possible to benefit from directional and non-directional price trends. So yes, the ADX is also good for options trading. Best regards, Andy
I don’t know about trading and never tried it. But through your post now I have some knowledge about trading. Because I have never traded in my life so I hear about the ADX for the first time. I understand through your post that ADX is beneficial for traders or stock investors looking into price action tools. You explain so well How does ADX work and what can it show in the results it generates. I will share this post with my friends who are interested in trading.
Hi and thanks for your comment. I am glad you found it easy to understand and useful. Best regards, Andy
Thank you so much for the effort put into providing this website. Calculating the ADX has been a challenge and i have been unable to understand the whole process. But after going through your article and the step by step illustration of the procedures to the calculation, i think i can now work effectively on it. Thanks alot for the effort.
Hi and thanks for your comment. I am glad that you found it easy to follow. Best regards, Andy