Bad Investment Advice
and ways to avoid it
Menu Close
  • Home
  • About Andy
  • Analysis
    • Fundamental analysis
    • Quantitative analysis
    • Technical analysis
  • Investment
    • Instruments
      • Bonds
      • Cryptocurrencies
      • Gold and silver
      • Options
      • Real Estate
      • Stocks
    • Principles
      • Financial bubbles, scams
    • Strategies
  • Personal Finance
    • Planning
    • Debt relief
    • Retirement
    • Taxes
  • Reviews
    • Books
    • Products and Services
  • Trading

Technical analysis

Technical analysis

20

What is the best charting method for stock trading?

Posted on November 20, 2021 by Andy
What is the best charting method for trading

What is the best charting method for stock trading? A simple answer could be – The method that best suits your trading style. But that answer is as good as useless so here is a better answer. The best charting… Continue Reading →

Analysis, Instruments, Investment, Stocks, Technical analysis, Trading
16

Point figure stock charts

Posted on November 8, 2021 by Andy
Point figure stock charts

Have you been wondering how to read point figure stock charts? Or have you dismissed them as an old-school traders’ technique that belongs to the past? Whatever your impressions may be, point figure charts have been used by traders and… Continue Reading →

Analysis, Technical analysis, Trading
18

How do I trade using daily weekly and monthly charts?

Posted on November 3, 2021 by Andy
How do I trade using daily weekly and monthly charts

How do I trade using daily weekly and monthly charts? Use daily candlestick charts going back a few weeks to find entry and exit points for swing trades of a few days or more. Look for classic price reversal or… Continue Reading →

Analysis, Technical analysis, Trading
20

What should I learn first in the stock market?

Posted on October 10, 2021 by Andy
What should I learn first in the stock market

What should I learn first in the stock market? Should it be fundamental analysis or technical analysis? Or should I just learn how to mine datasets and look for an algorithm that beats the market? This question is usually asked… Continue Reading →

Analysis, Fundamental analysis, Technical analysis
14

What is negative divergence in the MACD?

Posted on April 13, 2021 by Andy
What is negative divergence in the MACD

What is negative divergence in the MACD? Negative divergence in the MACD is when the price of a stock or ETF is making higher highs but the MACD is making lower highs. It is a bearish indicator in a price… Continue Reading →

Analysis, Technical analysis, Trading
26

Swing trading for a profit

Posted on December 3, 2020 by Andy
Swing trading for a profit

Many investors and traders who are building their knowledge and experience with investing and trading will wonder whether to get into swing trading for a profit and just how profitable swing trading can be. First, we need to define swing… Continue Reading →

Analysis, Investment, Strategies, Technical analysis, Trading
34

What’s growth investing?

Posted on October 29, 2020 by Andy
What is Growth Investing

What’s growth investing, how does that compare with value investing, and is one better than the other? This seems a simple question. The simple answer is – that depends. We already looked at value investing with a thorough review of… Continue Reading →

Analysis, Books, Investment, Principles, Reviews, Strategies, Technical analysis
18

Reading candlestick charts and patterns

Posted on October 10, 2020 by Andy
Candlestick patterns and charts

Reading candlestick charts and patterns is one of the most important skills a trader can learn. There are many candlestick patterns. There are single candle patterns, two candle patterns, three, and more candle patterns. Candlestick patterns have been around for… Continue Reading →

Analysis, Technical analysis
16

How to use moving averages to trade

Posted on September 24, 2020 by Andy
How to use moving averages to trade

Every stock market investor needs to know how to use moving averages to trade stocks. Every charting package and online brokerage platform worthy of the name will allow you to superimpose moving averages onto stock price charts. The first questions… Continue Reading →

Analysis, Technical analysis
10

Use Bollinger bands effectively

Posted on September 9, 2020 by Andy
Use Bollinger bands effectively

Every trader needs to know how to use Bollinger bands effectively. Of all the trading tools out there, Bollinger bands are among the most popular for good reasons. Bollinger bands are easy to read and use. Bollinger bands show when… Continue Reading →

Analysis, Technical analysis
16

Best use of the Stochastic oscillator

Posted on August 21, 2020 by Andy
Best use of the Stochastic oscillator

What is the best use of the stochastic oscillator? An excellent question. Let’s start with a simple definition. The Stochastic oscillator is a price momentum tool that moves between 0 and 100 and shows when a stock may be overbought… Continue Reading →

Analysis, Technical analysis
14

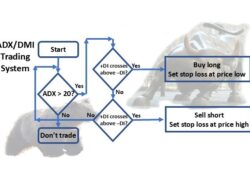
What is the ADX?

Posted on August 14, 2020 by Andy
What is the ADX

If you are a trader or stock investor looking into price action tools, at some point you will need to know what is the ADX. How does it work and what can it show me. The ADX stands for the… Continue Reading →

Analysis, Technical analysis
16

Why is volume important in stock trading?

Posted on July 17, 2020 by Andy
Why is volume important in stock trading

Why is volume important in stock trading? There is a straight and simple answer to this question – volume is important because it shows the strength of price movement. Like with most price phenomena in the stock market, we are… Continue Reading →

Analysis, Stocks, Technical analysis, Trading
26

Fibonacci sequence stock trading

Posted on July 6, 2020 by Andy
Fibonacci retracement trading

What is Fibonacci sequence stock trading, does it work and why do traders use this method and what if anything does it have to do with the golden ratio? These are all good questions that we will look into here.… Continue Reading →

Analysis, Technical analysis, Trading
28

Relative strength indicator calculation

Posted on June 29, 2020 by Andy
Relative Strength Index

If you are a stock trader or investor who is having trouble sleeping at night because you don’t know how to do the relative strength indicator calculation, then worry no more. You’ve come to the right place. How relative is… Continue Reading →

Analysis, Technical analysis, Trading

Post navigation

Older Articles

Recent Posts

  • Is leverage trading risk-free?
  • What is the best charting method for stock trading?
  • Point figure stock charts
  • How do I trade using daily weekly and monthly charts?
  • What should I learn first in the stock market?

Recent Comments

  • Andy on Stock market cycle indicator
  • online pharmacies canada on Stock market cycle indicator
  • Andy on How to do technical analysis of stocks – part 1
  • Mikhail on How to do technical analysis of stocks – part 1
  • Andy on About Andy

GoldCo

Diversy Fund

Tiller Money

MyConstant

MyConstant banner

AAII

The Millionaire Next Door

The Millionaire Next Door : The Surprising Secrets of America's Wealthy

Wealthy Affiliate

Empower High interest checking

Subscribe to receive email notification of new posts

  • Privacy Policy
  • Affiliate Disclosure Statement
  • Glossary
© 2023 Bad Investment Advice. All rights reserved.
Hiero by aThemes
We use cookies to ensure that we give you the best experience on our website. If you continue to use this site we will assume that you are happy with it.Ok