
Understanding how stocks are evaluated can feel like trying to read an ancient map. It’s easy to get lost in all the numbers and indicators. Taking the time to grasp why stock evaluation matters can pay off big time for anyone stepping into investments.
At its core, stock evaluation helps in making informed choices about when to buy, hold, or sell equity in a company. Without it, personal investment decisions would be like darts tossed in a dimly lit room, hoping for a bullseye.
There’s a clear line between fundamental and technical analysis in stock evaluation.
Fundamental analysis is a precise science that digs into the business’s actual workings—profits, debts, and assets. Think of it like checking a car’s engine before purchasing it.
On the flip side, technical analysis is more of an art that looking for patterns and trends in stock price movements and trading volumes, more like studying the car’s performance history.
Data and insights are king in the world of evaluation. Understanding trends, ratios, and market conditions is critical. The more information gathered, the better equipped you are to make a well-informed decision, reducing the odds of nasty financial surprises.
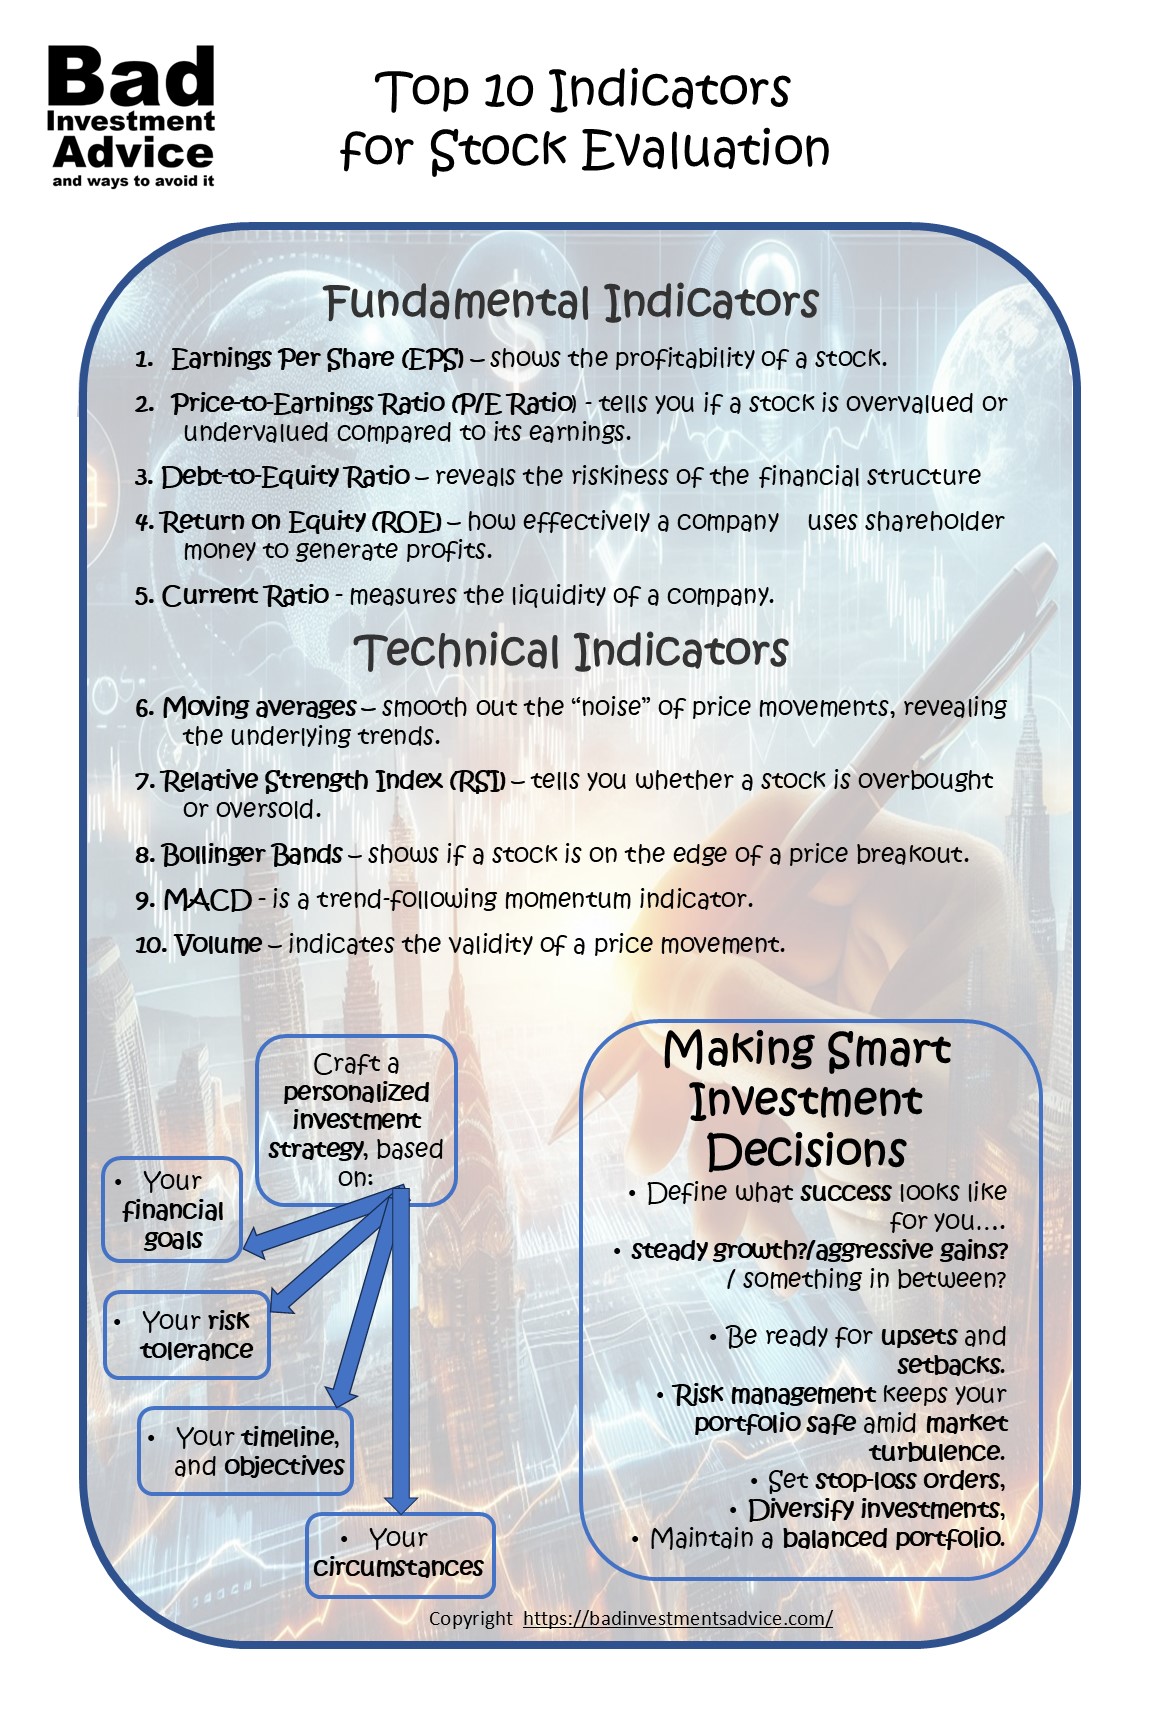
Fundamental Indicators: Building a Strong Financial Foundation
The world of fundamental indicators starts with Earnings Per Share (EPS). This metric acts like a quick health check, showing how much money a company makes per share. Investors use EPS to assess profitability. A higher EPS generally means more profitability, a good sign when considering investment.
The Price-to-Earnings Ratio (P/E Ratio) comes next. This indicator compares a company’s share price to its earnings per share. Essentially, it tells you if a stock is overvalued or undervalued compared to its earnings. A high P/E might mean the stock’s price is high relative to earnings, hinting at overvaluation, while a lower P/E could suggest the opposite.
Debt-to-Equity Ratio is another heavyweight champion in stock evaluation. It shines a light on a company’s financial structure by measuring the relationship between borrowed funds and owned funds. It’s like knowing how much of your house is mortgaged. A high ratio might indicate higher risk, as the company might lean too heavily on borrowed money.
Return on Equity (ROE) measures how effectively a company uses shareholder money to generate profits. It’s a favorite among investors looking to understand management’s ability to generate returns from their investments. High ROE, compared to industry peers, can signal a well-managed company that efficiently turns funding into profits.
The Current Ratio measures the liquidity of a company. It is a simple calculation of the current assets divided by current liabilities. It gives an indication of a company’s ability to meet its short-term debts and stay in business. As with other indicators, it is useful to compare a company’s current ratio with similar companies in the same industry. If a company’s current ratio is dramatically lower than its competitors, that would be a red flag.
For anyone who wants to dig in further, here is a more detailed article on fundamental analysis.

Technical Indicators: Reading Between the Lines
Technical indicators offer another dimension to stock evaluation by focusing on price and trade volume data to try to predict short-term and long-term trends.
Moving averages are one of the most popular indicators used to study stock price movement. A simple moving average tracks the mathematical average price over a set number of previous periods. An exponential moving average also tracks the average price of a set number of previous periods but the prices of the most recent periods are given greater weighting. Moving averages smooth out the noise of price fluctuations over time, helping to identify the overall direction of a stock’s movement. They’re like the compass that keeps traders orientated amid the daily ups and downs.
The Relative Strength Index (RSI) is another crucial indicator typically used to identify when a stock is overbought or oversold. Ranging from 0 to 100, this momentum oscillator can signal that a stock might reverse direction, offering buy or sell signals. For instance, an RSI above 70 might suggest a stock is overbought, whereas below 30 might indicate an oversold condition.
Bollinger Bands create a visual picture of a stock’s volatility. By plotting bands at a standard deviation level above and below a moving average, they indicate when a stock might be on the edge of a breakout or breakdown. Traders use these bands to understand pricing direction, give a head’s up on potential upcoming price actions, and balance between high volatility periods and those just coasting along.
Then there’s the MACD, or Moving Average Convergence Divergence. It’s a trend-following momentum indicator showing the relationship between two moving averages of a stock’s price. This can guide investors on the momentum swings, helping spot potential buy and sell points when the MACD line crosses above or below the signal line, steering clear of unnecessary risks.
Volume itself is one of the most important indicators to watch. Look at trading volume during a significant price movement, particularly if that price movement is in a positive direction. If a steep upwards movement in price is matched by greater than average trading volume then that price movement is valid. On the other hand, if the trading volume is low then that price movement is less valid and that upward movement is more likely to collapse. Here is a more detailed look at the importance of trading volume.
Bringing It All Together: Making Smart Investment Decisions
Bringing together fundamental and technical indicators is where the magic happens in stock evaluation. It’s not about choosing sides but combining these insights for a well-rounded picture. Each type of analysis adds a layer to your understanding, allowing you to make choices with both the company’s health and current market behavior in mind.
Crafting a personalized investment strategy is crucial. Everyone’s financial goals differ, so tailoring an approach that fits your risk tolerance, timeline, and objectives makes all the difference. It’s about defining what success looks like for you—whether it’s steady growth, aggressive gains, or something in between.
Market sentiment and news are the wild cards that no evaluation system can ignore. Economic reports, industry news, and global events can swing stock prices unpredictably. Staying informed on the latest news keeps you proactive, not reactive, in your investment journey.
Risk management is the anchor that keeps your portfolio safe amid market turbulence. Setting stop-loss orders, diversifying investments, and maintaining a balanced portfolio are all parts of safeguarding your assets. It’s about preparing for the unexpected while maximizing opportunities for growth.
Answers to frequent questions
Q. What are the best and most accurate indicators for stock analysis?
A. It is generally accepted among traders that moving averages, the RSI, Bollinger Bands and the MACD are best for spotting trends for short-term trades,
Q. What is the 10am rule in stocks?
A. The 10am rule recognizes that during the first half-hour or so of trading, price movement can be erratic. It takes that time for the market to establish its direction for the day. For this reason traders will often avoid opening any position before 10am.
Q. What is the Golden Cross indicator?
A. A Golden Cross is when the 50-day moving average crosses above the 200-day moving average. A Super Golden Cross is when the 50-day moving average crosses above the 200-day moving average and stays above it for 3 days. It is generally accepted that this means the upward trend in price is firmly established.
Affiliate Disclosure: This article contains affiliate links. If you click on a link and buy something, I may receive a commission. You will pay no more so please go ahead and feel free to make a purchase. Thank you!
It has often been said that there is no better investment than your own financial education. One great way to accelerate your financial education and your investing success is with the American Association of Individual Investors, the AAII. When you join the AAII, you get access to reports, courses on investing, risk management, asset allocation, retirement planning, managing retirement finances, and other resources, all for a single annual membership fee.
Here is a single-page summary of the top 10 indicators for stock evaluation. You can download a pdf here.
I hope you found this article interesting and useful. Do leave me a comment, a question, an opinion, or a suggestion and I will reply soonest. And if you are inclined to do me a favor, scroll down a bit and click on one of the social media buttons, and share it with your friends. They may just thank you for it.
You can also subscribe to email notifications. We will send you a short email when a new post is published.
Disclaimer: I am not a financial professional. All the information on this website and in this article is for information purposes only and should not be taken as personalized investment advice, good or bad. You should check with your financial advisor before making any investment decisions to ensure they are suitable for you.
Affiliate Disclosure: This article contains affiliate links. If you click on a link and buy something, I may receive a commission. You will pay no more so please go ahead and feel free to make a purchase. Thank you
You have provided much good information on evaluating stocks. Understanding the difference between fundamental and technical analysis is essential. This information will help improve investment decisions. I will share this with friends and family.
Thanks for the positive feedback. I am glad you found it helpful.
Hi Andy,
I am grateful I have came across your article on stock evaluation because I didn’t have any idea of what this was beforehand.
But I have learned quite a lot from you on here and if I am ever questioned or challenged in the future on stock evaluation then I will know who to go to if I need any help.
Thank you for sharing and keep up the great work.
All the best,
Tom
Hi Tom. Thanks for taking the time to comment. I am glad you found it helpful. Best, Andy
Would there be any value in creating a seies of glossary/reference pages? Perhaps that’s something you’ve already thought of, or done. Evergreen content keeps people coming back.
Great minds think alike. I did create a glossary some time back. I have to check if it is still working properly. Thanks for the prompt.