Every stock market investor needs to know how to use moving averages to trade stocks. Every charting package and online brokerage platform worthy of the name will allow you to superimpose moving averages onto stock price charts.
The first questions with moving averages are:
- what settings should I use – simple, exponential, or some other exotic kind of moving average?
- what period or periods should I use?
- how do I read them for trading signals?
Let’s look at each of these in turn.

Simple moving average vs exponential moving average
First off let’s remind ourselves that a moving average is an average of a set number of data points in a time series. For stock prices, if we have a series of daily closing prices, a 10-day moving average would just be a sequence of prices that are an average of the current price and the prices of the nine previous days.
An exponential moving average is a special case of a weighted moving average and the simplest case of a weighted moving average is a linear weighted moving average. It is easiest to consider the differences between simple, linear weighted and exponential moving averages by looking at the multiplying factors. Here is a simple illustration.

Simple Moving Average and Exponential Moving Average are often abbreviated to SMA and EMA.
So which to use?
There is no simple rule whether to use simple or exponential moving averages. Generally, if a stock price is slow-moving SMAs can be used. While for faster-moving stocks it will be preferable to use EMAs. So, if you want your averages to be more responsive to recent price moves, the EMAs are typically a better choice.
Generally, the choice is a matter of personal preference. The exception to this principle is that if you find out that analysts are normally either using SMAs or EMAs to analyze a specific stock, then you are better off doing the same.
Essentially if moving averages are being used to program automated buy and sell signals in large volume then you will want to adopt the same approach.
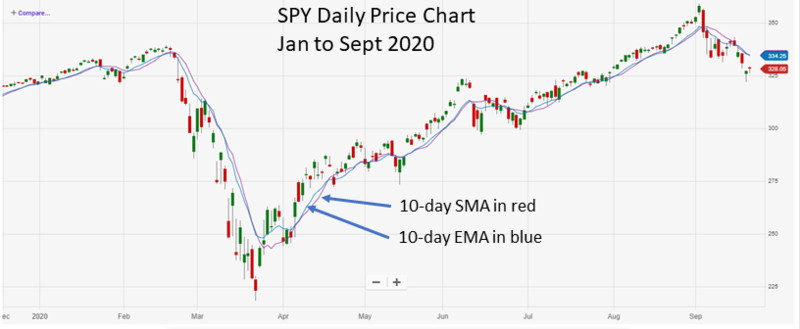
Let’s compare a 10-day simple moving average with a 10-day exponential moving average. This is a chart of the SPDR ETF, symbol SPY that tracks the Standard and Poor’s 500 index. This is a daily chart of the SPY and shows the period from January through September 2020.
As is still fresh in our memories, the market reached a peak in late February after a strong steady rise over the previous few years. In March the market collapsed, only to turn around and recover all its losses. by August.
Source: PowerE*TRADE
Here the red line is the simple moving average and the blue line is the exponential moving average.
There are just a few places on the chart where we can see the exponential average has more accurately responded to rapid price movements than the simple moving average. This is most noticeable immediately after the bottom of the bear market sell-off of March 2020.

Source: PowerE*TRADE
What happened
In the first few days of April, there was a short pullback in the market. The simple moving average ignored this as noise while the exponential moving average registered the dip. I’m not saying this is a big deal, after all, we watch the actual price action as the most significant information anyway and moving averages are just a way to look at price action while eliminating the noise.
However, if we had been using this moving average to signal buy or sell actions, and we were convinced the market was still a bear market having the price downturn at the beginning of April confirmed by a downturn of 10-day exponential moving average might have caused us to open a bear position on this ETF.
One main feature to notice is how the moving average often serves as a level of support during and uptrend and resistance during a downtrend. These periods are marked below.

Source: PowerE*TRADE
Intermediate-term 50-day and short-term 10-day
For trading purposes, it is usual to take a faster-moving average and a slower moving average and look at the times when the fast line crosses over the slower line. If we are looking for trades over a period of a few weeks to a few months a 50-day and a 10-day moving average would be a good choice.
Here is what the 10-day EMA and 50-day EMA look like on the SPY price chart for January through September 2020.

Source: PowerE*TRADE
However, before we go there and look for signals, we should zoom out to a larger time frame to assess whether the overall market is in an uptrend or in a downtrend.
Long-term 200-day
The 200-day moving average gives a general long-term picture of the overall trends in the market. Since there are five trading days in a week, the 200-day moving average is calculated over a 40-week period.
Here is the daily price chart for the SPY from January through September 2020 with the 10-day, and 50-day exponential moving average and the 200-day simple moving average. I am using the simple moving average for the 200-day period as I am not concerned with rapid changes but I want to reveal the overall price trend.

Source: PowerET*RADE
One thing this shows us quite clearly is that we need to zoom out to a wider timeframe to get a better sense of what is happening and see the overall trend. Here is the SPY daily price chart with the same moving averages for the period 2015 through September 2020.

Source: PowerET*RADE
Above or below the 200-day
Here we can more clearly see, looking at the 200-day average that there was an up-trending bull market that started around July 2016 and lasted into October 2018. Then, again looking at the 200-day average there was a period of sideways movement that lasted until June 2019 when an up-trending bull market was again established.
That bull market lasted until March 2020 when again, according to the 200-day moving average the long-term market entered a period of indecision through to around July 2020 after which point the uptrend took over again.
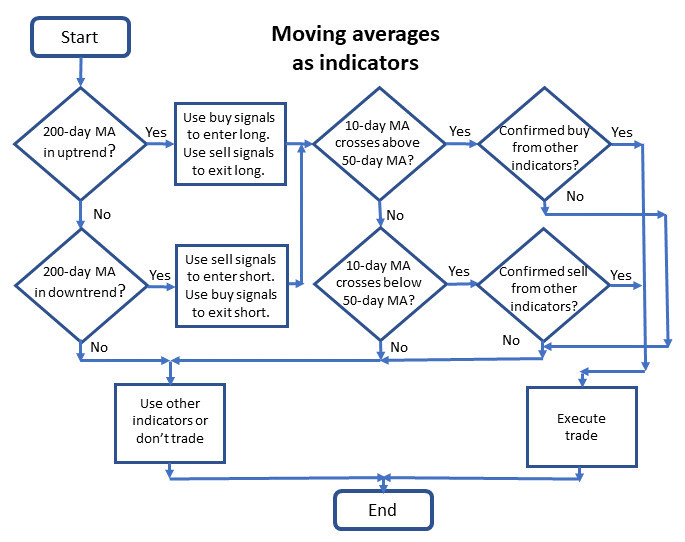
From the 200-day moving average, it does look as if we are in a long-term bull market. Since it is always best practice to trade in the intermediate-term within the general trend of the longer-term market, in those periods of long-term bull markets it makes sense to take long positions. This implies that buy signals will be entry signals and sell signals will be exit signals.
In the periods of sideways market movement, it makes sense to trade a mixture of bullish i.e. long and bearish i.e. short positions or to sit on the sidelines in cash.
Moving averages – a flow chart
Here is how most traders use moving averages, expressed in a flow chart.
10-day crossovers of the 50-day
Let’s look again at the daily price chart for the SPY from January to September 2020. Here are the points where the 10-day moving average crosses over the 50-day moving average.

Source: PowerE*TRADE
The sell signal on the first crossover happened on 26 February. We were still in a long-term bull market at the time so this would have been a good signal to exit long positions.
The next crossover was the buy signal that happened on 28 April. At that point, from a long-term perspective, the market was still trading sideways and hadn’t decided whether to enter a bear market or resume the bull market. So whether we would have taken that crossover as a buy signal to enter long positions or a buy signal to exit short positions, or both, or neither would have been our choice at the time depending on how we interpreted other signals and indicators.
Currently, 22 September the 10-day moving average is heading for a crossover of the 50-day moving average. We will see over the next days whether that happens. The 10-day already crossed over the 20-day moving average on 14 September.
So what does this mean?
Well, if we think that on a long-term basis the bull market has re-established itself, then sell signals would be a trigger to exit long positions. If we are still undecided about the longer-term trend then a sell signal could also trigger entering short positions.
Moving averages on other price charts.
So much for the SPY that tracks the Standard and Poor’s 500 index. Let’s have a look at the same moving averages on some other price charts.
A technology ETF – QQQ
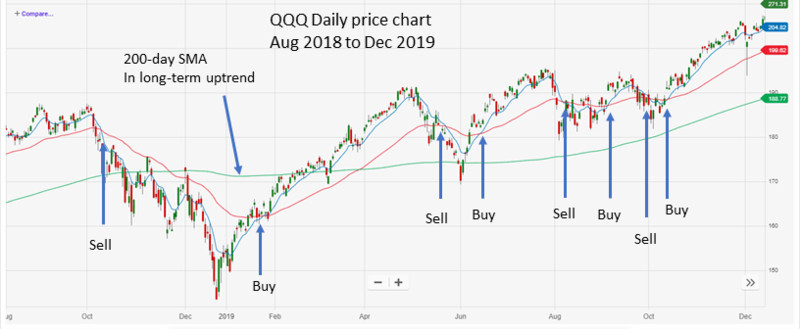
The Invesco ETF with the symbol QQQ is based on the NASDAQ 100 index. Because of the stocks that make up the NASDAQ 100, QQQ is very heavy in technology stocks. Here is what the QQQ daily price chart from August 2018 to December 2019 with 10-day, 50-day, and 200-day moving averages.
Source: PowerE*TRADE
The first thing to notice is that during this whole period the 200-day moving average showed a continuous long-term uptrend. You could argue this was not a very strong signal and that could influence your trading decisions in that period.
If we consider all the times the 10-day moving average crosses over the 50-day moving average to be a buy or a sell signal then we can see we would have been in a bit of a buying and selling frenzy without much overall vertical movement and hence profit resulting.
Overall we would have been better off acting only on the first sell and the first buy signals in this period, and just holding for the rest of the time, if, we were only trading off of these moving average crossovers.
Let’s have a look at another.
SPDR Gold Shares ETF – GLD
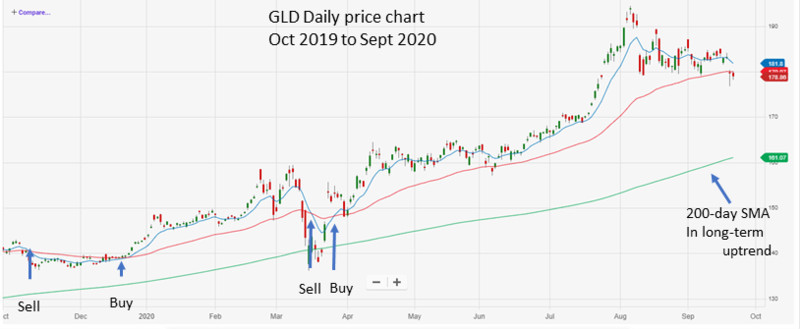
The SPDR Gold Share ETF, symbol GLD is an ETF that tracks the gold price. Here is a chart of GLD from October 2019 to September 2020 also showing the 10-day, 50-day, and 200-day moving averages.
Source: PowerE*TRADE
Like for the previous charts, we look first at the 200-day average. Over this period it suggests that the GLD was in a clear and strong long-term bull market.
The first two signals to sell and buy would likely have been reasonable signals to follow. As was the case for the QQQ above, the next signals would have just been useless noise. Again, in all likelihood, we would have been looking at other indicators to determine when and how to act.
A hotel and entertainment services stock – MAR
Marriott International Inc is a hotel and entertainment services company with a market capitalization of over $30 billion. Marriott had been trading sideways from a long-term perspective since January 2018 until the end of February 2020. Then along with everything else the stock price took a tumble when the markets caught the coronavirus.
Here is the price chart of Marriott International, symbol MAR, from June 2017 to November 2019 also showing the 10-day, 50-day, and 200-day moving averages.

Source: PowerE*TRADE
Looking first at the 200-day moving average we see a mixed picture for long-term trends. For simplicity here, I have just marked the chart as either a long-term uptrend or a long-term downtrend. In reality, there would be a distribution phase at the end of the first large uptrend before the downtrend starts.
Similarly, there would be an accumulation phase at the beginning of January 2019 before the price uptrend starts. Here is an article that explains more about accumulation and distribution phases and stock market cycles.
I think it is fair to say looking at this chart that it would have been unwise to base trading decisions on moving average crossovers for this time period.
Tools in a trading system
Moving averages are basic and useful tools and it is well worth traders and investors getting a good understanding of how they work and how to use them.
Like all indicators, they are tools to be used and should always be used in conjunction with other indicators. We should always remember that price movement itself is always the most important indicator.
For other indicators to use with moving averages, check out the MACD, the RSI, and the Stochastic oscillator.
Here is an article that gives more detail on moving averages.
Answers to questions
Q. Which are the best moving averages for trading?
A. The answer to this question depends on your trading timeframe. Generally, it is good to get an overall sense of the market direction by looking at a moving average, and other indicators of a time frame larger than the one you are trading in. If you are trading in the intermediate-term of say a few weeks to a few months, then as the example here did, look at a 200-day average to get the sense of where the market is heading in the long-term. Then favor trades in that direction.
Again, if your trading time frame is a few weeks to a few months then use a 10-day moving average as your faster average and a 50-day moving average as your slower average.
Q. When should you buy and sell using moving averages?
A. When the faster average crosses up through the slower average, that is a buy signal. When the faster average crosses down through the slower average, that is a sell signal.
Q. What other indicators should I use with moving averages?
A. Use other indicators to confirm crossover signals from the moving averages. The RSI can be used to confirm signals, also the Stochastic oscillator can be used. Other good confirmation signals would be the MACD and candlestick patterns.
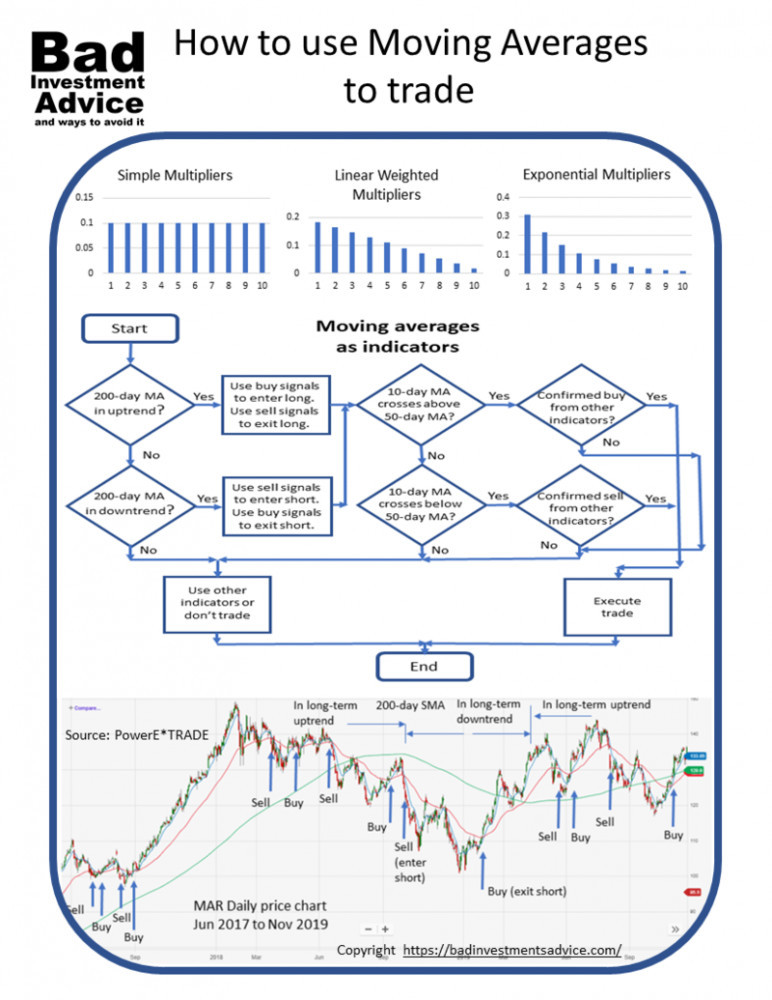
Single-page summary
Here is a single-page summary of how to use moving averages to trade you can download as a PDF.
I hope you found this article interesting and useful. Do leave me a comment, a question, an opinion, or a suggestion and I will reply soonest. And if you are inclined to do me a favor, scroll down a bit and click on one of the social media buttons and share it with your friends. They may just thank you for it.
Disclaimer: I am not a financial professional. All the information on this website and in this article is for information purposes only and should not be taken as investment advice, good or bad.
Affiliate Disclosure: This article contains affiliate links. If you click on a link and buy something, I may receive a commission. You will pay no more so please go ahead and feel free to make a purchase. Thank you!
The proper use of a moving average and multiple averages on the chart can really make the real difference between losing money and making money. What you have shared here is really useful to see and learned a great deal of the finer details of how to use moving averages. A really worthy thing altogether. Being myself a new trader, this article is really a great help.
Hi Nath and thanks for your comment. i am glad you found the article useful. Best regards, Andy
This is a big opportunity for stock traders to read about, because it’ll teach them a lot and using moving average to trade is something very important for them to know about. Thanks for sharing this, it’ll be of help to a lot of people, I’ll share it to some of my stock traders friends and I’m sure they’ll love it.
Thanks for the comment Bruce. Best regards, Andy
Hello there, trading is surely a very clever and I have to say I’m happy about it and I have to say that it’s a great idea and many people may be looking for ways to learn it and go into the details of moving averages. I have been really keen on learning. I learned a great deal from this article.
Hi Justin, Thanks for your comment. I am glad that you found it useful. Best regards, Andy
Thank you so much, Andy, you are able to explain this material really well! And thanks also for the pdf, I am going to put it on my bulletin board.
I keep forgetting I should treat ETFs as stocks. I hadn’t invested for quite some time and started over last year. ETFs are new to me and I am still trying to get used to them. That’s why your articles are very helpful to me. 🙂
Hi Hannie. ETFs are quite a game-changer in that they make index and sector investing so easy and at such low cost. One little known factoid is that many actively managed funds keep a lot of their holdings in publicly traded low-cost indexed funds. You could almost ask yourself – why pay the high fees for an actively managed fund if all they do with your money is invest in funds you can buy directly yourself anyway, and they charge you a fee for it. Best regards, Andy
I attended a course many years ago to read the candlestick patterns. Used to make some money but got burned later. At the end of the day, the mindset and discipline is very important. When you enter and when ensure discipline stop loss is crucial. Don’t go into a Hope analysis situation. I sincerely think you have done really well in explaining the use of the moving averages to trade.
Hi and thanks for stopping by and leaving this comment. Best regards, Andy
Your post is really helpful because to put it simply I have no knowledge of trading – having read your post, it is not as complicated as I thought. And your post provides ‘newbies’ like myself alot of valuable detail which is easy to understand. Thanks for taking time to provide this info.
Thanks for taking the trouble to leave this comment. I am glad you found the article easy to read and informative. Best regards, Andy
Hi,
From my online studies on how to use moving averages to trade the simple moving average is one of the most popular and simplest indicators. The simple moving averages price data and helps to reveal trends. Visually, it is a line. It reliably tracks the chart and smoothing out random price fluctuations. It shows the direction where the asset’s value is moving.
Thank you.
Aluko.
Hi Aluko and thanks for the comment. Indeed the simple moving average is one of the first studies to add to a basic price chart. Best regards, Andy
I have been trying to figure out how I can craft a guide for me when to use simple or exponential moving averages. And the more I read, the more I discover that there will never be a set of rules to follow. And this agrees with what you also explain here in your article. I appreciate your take on this. Thanks!
How can we we determine when the exponential average has responded to rapid price movements and is better to use it than the simple moving average?
Hi Paolo, I think the determination of whether to use exponential or simple moving averages depends on many factors: the stock itself, how liquid is the market, whether it is volatile and fast-moving, your trading time horizon, and your preferred trading approach. Look at charts for the particular stock that cover your trading time horizon and at least one larger, then see whether a simple moving average or an exponential moving average gave you the indications you would have wanted over past periods. Very often for slow-moving stocks, there isn’t much difference between exponential and simple moving averages. Typically it will only be at price turnarounds that you see a difference in the timing of signals. However, don’t just check the turn-arounds where you would want to have acted, check also the would-be price turn-arounds that didn’t materialize, and where you would not want to have taken either entry or exit action. I hope this helps. Best regards, Andy