Anyone who has invested in stocks for a while will know that the market goes through cycles, not just ups, and downs but distinct phases that repeat. You might also have noticed that certain assets perform better during different market phases. So if you are caught holding assets that do not perform well when the market cycle shifts to a new phase, then you suffer losses. This prompts the question, what are the stock market cycles, and if I could find a stock market cycle indicator could I use this to shift into different assets to benefit from a new market cycle.
Stock market price fluctuations
What drives prices up and down? The simple answer is supply and demand. If there is more demand than supply that drives prices up if there is more supply than demand that drives prices down.
It is easy to be bewildered by prices moving constantly up, down, and sideways. It can be more daunting when you are trying to work out when to get in or get out and knowing that there are other traders and investors out there all trying to outwit each other and to outwit you.
When asked by a young investor what he thought stock prices would do, J. P Morgan famously said,
“They will fluctuate, young man, they will fluctuate.”.
As explored in this other article on technical analysis, one of the main assumptions of the technical analysis approach is that price fluctuations follow discernible patterns. There are indicators that can reveal when a current cycle is about to move into another phase, these are called leading indicators.
There are also indicators that confirm what just happened and that it is continuing to happen in the markets. These are called lagging indicators.
Stock market cycles and economic cycles

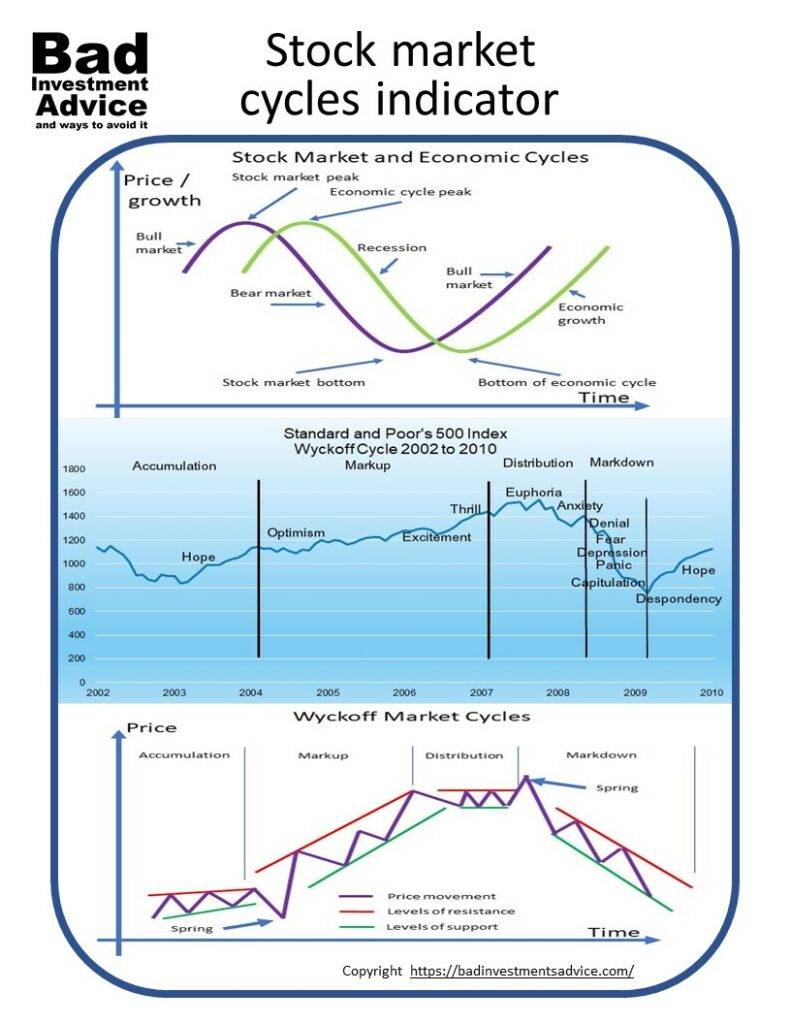
The stock market goes through its cycles and the economy follows through similar cycles. It is a well-established observation that stock market growth precedes economic growth and a stock market decline precedes an economic recession.
When the stock market tips into a prolonged downtrend that’s an indication that a recession is on the way. Conversely, a confirmed bull market rise in the stock market will start before a recession has ended and will likely be followed by economic growth.
That’s great if you are in business trying to decide whether the economy will be favorable for a new venture or product launch but it’s frustrating if you are an investor or trader wondering what moves to make in the market.
Money and emotions
There are four distinct phases that can be identified. Each phase has a distinct price behavior and at the same time is characterized by an emotional counterpart. The price behavior and emotional counterpart feed into and react to each other.
The first person to document a theory of market price cycles was Richard Wyckoff way back in the late 19th century and early 20th century. He noticed four distinct phases, accumulation, markup, distribution, and markdown. Here is what Wyckoff’s model looked like.

As the chart shows, prices move between levels of support and resistance during each phase. After testing the levels of resistance a few times buyers gain the upper hand and the price breaks through from the accumulation phase to the markup phase.
A similar pattern is seen at the end of the distribution phase, after testing support levels a few times, sellers eventually win and breakthrough and the markdown phase starts.
Who drives the market?
There is an important fact to remember.
The public mood that characterizes each phase is an experience shared broadly by many. However, somewhere around 80 percent of the trading volume in the market is due to large institutional investors. Whatever the institutional investors are doing drives what happens in the market and there isn’t much that small investors can do to influence matters.
The best the small investor can hope for is to gather some crumbs that may fall from the banquet table where the institutions are feeding.
If that invokes images you may have seen in movie versions of Charles Dickens Oliver Twist when the hungry orphans look longingly at the board of governor’s dining table – sorry for the melodrama but that’s about right.
The Wyckoff market cycles explained
Accumulation – the accumulation phase starts after the market has reached the bottom following a decline that has wiped out everyone who is selling out. At the very market bottom, the predominant emotion is despondency.
The early buyers entering during the accumulation phase are the smart money investors. The public mood shifts from despondency to depression still not ready to believe in the price upswing as the dominant stories in the media are about the ongoing recession.
At some point with mounting evidence of rising prices, the media takes more notice and reports the end of the recession. Wyckoff theorized that there is a big selloff where the last sellers give up and sell out. That is a spring point that looks like a break to even lower prices but actually, buyers are winning.
The cycle moves into the next phase and the public mood shifts from depression to hope.
Markup – as media attention reinforces the perception that the recession is clearly over, the economy is growing, the bull market is in full swing, the public mood transitions from hope through relief and then into optimism.
Most of the money now entering the market is institutional investors getting back in or building themselves stronger positions. Now we are really in a solid bull market. Optimism becomes excitement and prices continue their relentless climb.
Eventually, we approach the end of the markup phase. The overwhelming evidence of prices going ever higher turns excitement into thrill, now many smaller, new, and less experienced investors start jumping into stocks trying to not miss the boat.
The public mood of thrill gives way to euphoria. Most of the smart money will have left by now. Finally, all the indicators show that the market is overbought and the big institutions decide that the bull market has run its course even though the economy is still growing.
Distribution – as the sellers take over they start to dominate the market. Again like at the end of the accumulation phase there is one final buying spurt but the big institutional money is selling so the distribution phase tips the market into a downtrend. Euphoria is replaced by anxiety.
Markdown – The full bear market is now confirmed. Sellers still dominate and drive prices even lower. Small and inexperienced investors who bought in during the bull market are wondering what they got themselves into.
This is when a big selloff comes. Ever declining prices push the general mood from anxiety through denial, then fear, and later desperation. Some small investors are still holding on but prices continue to push lower.
Desperation finally gives way to capitulation and the last of the small and inexperienced investors sell out. By the end of this phase, everyone who is selling eventually sells right at the bottom.
At this point when the bottom is reached, the sellers have run their course. All the indicators are showing that the market is oversold. Another phase of accumulation starts.
How long the cycles last
If we examine the historic data, taking the Standard and Poor’s 500 Index as an indicator for the market, we see that bull markets last longer than bear markets.
We should remember that a bull market is defined as a market that rises 20 percent from the previous low and a bear market is defined as a market that declines by 20 percent or more from the previous peak.
The bull market periods of rising prices last on average 6.6 years and achieve an accumulated 339 percent increase while the big bear market periods of declining prices last on average 1.3 years and experience a cumulative loss of 36 percent.
Here is what those bull and bear market periods look like on a timeline from 1926 to 2019.
Footnote1)The historical data for the S&P 500 annual returns, were taken from this site. All calculations and charts here were made by Bad Investments Advice for this article.
A complete cycle
This is what a complete cycle looks like for a recent period. This is for the Standard and Poor’s 500 index from 2002 to 2009.

As we can see the public mood progresses slowly at first through the positive emotions but has much less time to adjust from the euphoria of a market peak to the capitulation close to the subsequent market bottom.
Bull traps and bear traps

Something else to notice on this chart is the clearly visible Bear Trap and Bull Trap which typically occur early on in the Markup and Markdown phases respectively.
Early on a bull market, there can be a correction in the form of a sudden price drop. This can be a trap to bears who misread the signal and start for example short selling the market. However, if the short-term price correction is reversed and the market continues on the uptrend and short sellers will lose.
A similar situation can arise in a bear market. Early on there can be a short correction and prices suddenly rise again. This can be a trap for bulls who may be tempted to reenter the market taking new long positions. If the general downtrend continues the bulls will find themselves on the wrong side of the market.
Where are we right now
This is where we think we are right now in early June 2020.

To the question of where are we now – in June 2020 – Are we in a markdown phase or is it too early to say – I’d say the jury is still out.
On one hand, we know that the world economies are likely going to see difficult times ahead because of all the impacts of the coronavirus. We are likely to see recessions in many economies for the next few years.
On the other hand, there still seems to be investors in the market and central banks around the world are doing their best to learn the mistakes of the early 1930s and have drastically eased monetary policies.
I think this points to a period of price volatility and the rise we saw in April and May is looking more and more like a classic Bull trap.
Leading and lagging indicators
The stock market, housing starts, and consumer sentiment are considered leading indicators for economic cycles. Economic lagging indicators are the unemployment rate, interest rates, and business spending.
Leading indicators for the stock market
One of the most reliable leading indicators for the stock market was noticed by Joe Kennedy back in 1929. Mr. Kennedy was having his shoes shined and the young boy shining his shoes started to give him stock tips.
At that point, Mr. Kennedy realized he had to sell his stocks and leave the market fast because it had become too popular for its own good. He did just that and was able to avoid most of the carnage of the ensuing market crash.
Others have made similar observations in later years noting that when hot tip stock market investing becomes common conversational currency among the inexperienced public, that is a sign to pack up and leave like Joe Kennedy.
This article gives more detail about stock market cycles.
Affiliate Disclosure: This article contains affiliate links. If you click on a link and buy something, I may receive a commission. You will pay no more so please go ahead and feel free to make a purchase. Thank you!
It has often been said that there is no better investment than your own financial education. One great way to accelerate your financial education and your investing success is with the American Association of Individual Investors, the AAII. When you join the AAII, you get access to reports, courses on investing, risk management, asset allocation, retirement planning, managing retirement finances, and other resources, all for a single annual membership fee.
Here is a single-page PDF summary of stock market cycles indicator.
I hope you found this explanation interesting and useful. Do leave me a comment, a question, an opinion or a suggestion and I will reply soonest. And if you are really inclined to do me a favor, scroll down a bit and click on one of the social media buttons and share it with your friends. They may just thank you for it.
Disclaimer: I am not a financial professional. All the information on this website and in this article is for information purposes only and should not be taken as investment advice, good or bad
Affiliate Disclosure: This article contains affiliate links. If you click on a link and buy something, I may receive a commission. You will pay no more so please go ahead and feel free to make a purchase. Thank you!
Great article on the stock market. Very detailed and full of useful information as well. I will have to read it a few more times to get everything since my mind isn’t wired towards the markets, but it’s great information to have. Especially in the times we are living in.
Thanks for sharing.
Hi and thanks for the comment. I am glad that you found it interesting and useful. If there is anything you are unsure of or if you have any questions please drop me a line and I will respond soonest.
Best regards
Andy
Thank you so much for this highly informative article, Andy! I have been thinking about throwing my hat into the stock market arena (I have never invested or traded stocks before), but I always heard how volatile it was and how much money people could lose at any given moment. You do an excellent job of breaking down the stock market cycle, phase by phase, and explaining how they all work together to produce the trends and results that we see today. I have saved your site and will definitely be back! God bless you!
Hi CN. Thank you for your positive feedback and kind comments. I am very glad that you enjoyed the article and found it useful. The stock market is indeed likely to demonstrate a great deal of volatility. We saw some of that today. Thank you again. With my very best wishes, Andy
Hi Andy,
Great post on stock market cycles. There was a lot of great information here, I will need to get my note pad and pen out to take all of it down. How do you think the market is going to react to the last three months and will it sustain stability? Keep up the good work
Hi LJ. Thanks for the comment. I am glad you found it interesting. Since you ask I think the recent market rise we’ve seen over April and May is looking more and more like a classic Bull Trap. I don’t think that the market will be stable at all. I think volatility is far more likely. Thanks again and best regards, Andy
Great article Andy. Now more than ever, I have been thinking of investing in the stock market. I have done so in the past and lost a lot of money so naturally I am a bit hesitant. Nonetheless, your post has made me understand the cycle better. Book marked to come back! It is awesome! Thank you.
Hi Ekufaa and thanks for the positive feedback. Please do come back and let me know if you have any other reflections or questions. Best regards, Andy
Hi Andy,
I absolutely loved your story about Joe Kennedy and the lesson to be learnt from this.
I wholeheartedly agree that when Joe public starts discussing the ins-and-outs of a particular stock, it’s probably time to get out.
However, I believe for many inexperienced investors, without the correct management of their funds, they simply try to ride on the crest of a wave. Inevitably, far too late.
I also find your interpretation of April and May’s performance this year to potentially be a bull trap extremely interesting.
I know you’ve mentioned the jury’s still out on this one, but I’d love to know what you actually think the year ahead (and beyond) has in store for us.
Thanks
Partha
Hi Partha
As regards the Joe Kennedy story, at other times of market turmoil, notably after the dot com bubble, people have tried to replicate or test the thesis by interviewing people from different walks of life. They found ample evidence of similar phenomena. Of course, we should be careful not to be judgemental about the capacities, acumen, intelligence, etc of people from different walks of life. But generally yes, when inexperienced investors start to get enthusiastic and piling in, it is time to beware. Another observation is that fear drives certain parts of a bull market like fear drives parts of a bear market. Firstly towards the end of a bull market, it’s fear of missing the boat and towards the end of a bear market its fear of losing everything.
As regards the market currently, I do think we will see the bears return and over the next year or so prices will go lower.
But we shall see. Thanks much for your insightful comments.
Best regards
Andy
Hello Andy,
This is the best article I have read about the stock market. Despite I am a beginner in this field but I learned new things. What drives prices up and down? and the Stock market price fluctuations .. I learned from the story of Mr. Kennedy. Very interesting! It is really a great lesson..
You make me think of going back to the stock market.. May be I apply your advice in my new trial.
Best wishes in your business
Rania
Hi Rania
I am glad you found the article interesting and useful and thanks for your comment.
Best regards
Andy
Hi Andy,
Another very insightful post, well done. I found the graphs especially useful, however the bear and bull traps are something I’m going to have to work on. These are interesting times for the markets, it’s surprising in a way that they didn’t continue to crash for longer, it seemed to be primarily centered around the month of March.
Hi Sharon
Like you, I am not sure what we are looking at right now. Whether a major bear market decline has started for real or whether the market is going to head sideways for a while. It is interesting to see those bear traps and bull traps clearly visible in earlier market cycles. Good luck to us all! Thanks for the comment and best regards, Andy
Hi Andy,
I will definitely have to revisit this post! I have experience understanding cash flow, income statements, and balance sheets, but I do not have as much understanding of the different trends and stages that the market goes through (that is more my dad’s thing right now).
It’s funny as I hear some people refer to us being in a V shaped recovery while others say we are in a bubble.
What about stocks that don’t follow market trends? Is that where you see more the divide between value investing or growth investing?
Well wishes,
Sonia
Hi Sonia
I guess the question of how much attention you need to pay to market cycles is in some respects dictated by the time horizon of your investing or trading. I think that the main point for long term investors is that if they are able to shift the balance of their portfolio ahead of trend reversals into asset classes that will be favored by the reversal then you will stay ahead of the game. The unfortunate reality is that you are more likely to get it wrong and end up underperforming the market.
As for stocks that don’t follow the main market trends, they would be tied to a different asset class like an ETF of fixed-income bonds, or cash or classic income stocks such as utilities, or commodities. I think the investing strategy you are suggesting is neither value-stocks nor growth-stocks based but shifting between asset classes on the basis of relative strength. There are various ways of doing that. I actually think this is a very good approach to investing but it does take constant monitoring and, as always iron-willed discipline.
Thanks for your thoughtful and engaging comment.
Kind regards
Andy
Hi Andy,
This was a great read, thanks so much!
You explained the market cycles beautifully. This should really help your readers understand the best time to get in and out of certain markets.
I agree with you that this current time might be a bull trap, but then again, the world economy has never gone through a time such as this. Personally, I’m hanging on to see what happens.
Thanks again,
Suzanne
Hi Suzanne
Thanks for the comment. I agree this is a tricky time in the markets. There are many signs that the markets are overbought. On the other hand, the Fed has injected so much liquidity and scrapped so many rules that it is hard to know which way prices will go. I think volatility is likely to continue. Thanks again and best regards, Andy
Thanks for the positive feedback. I’m glad you found it helpful.