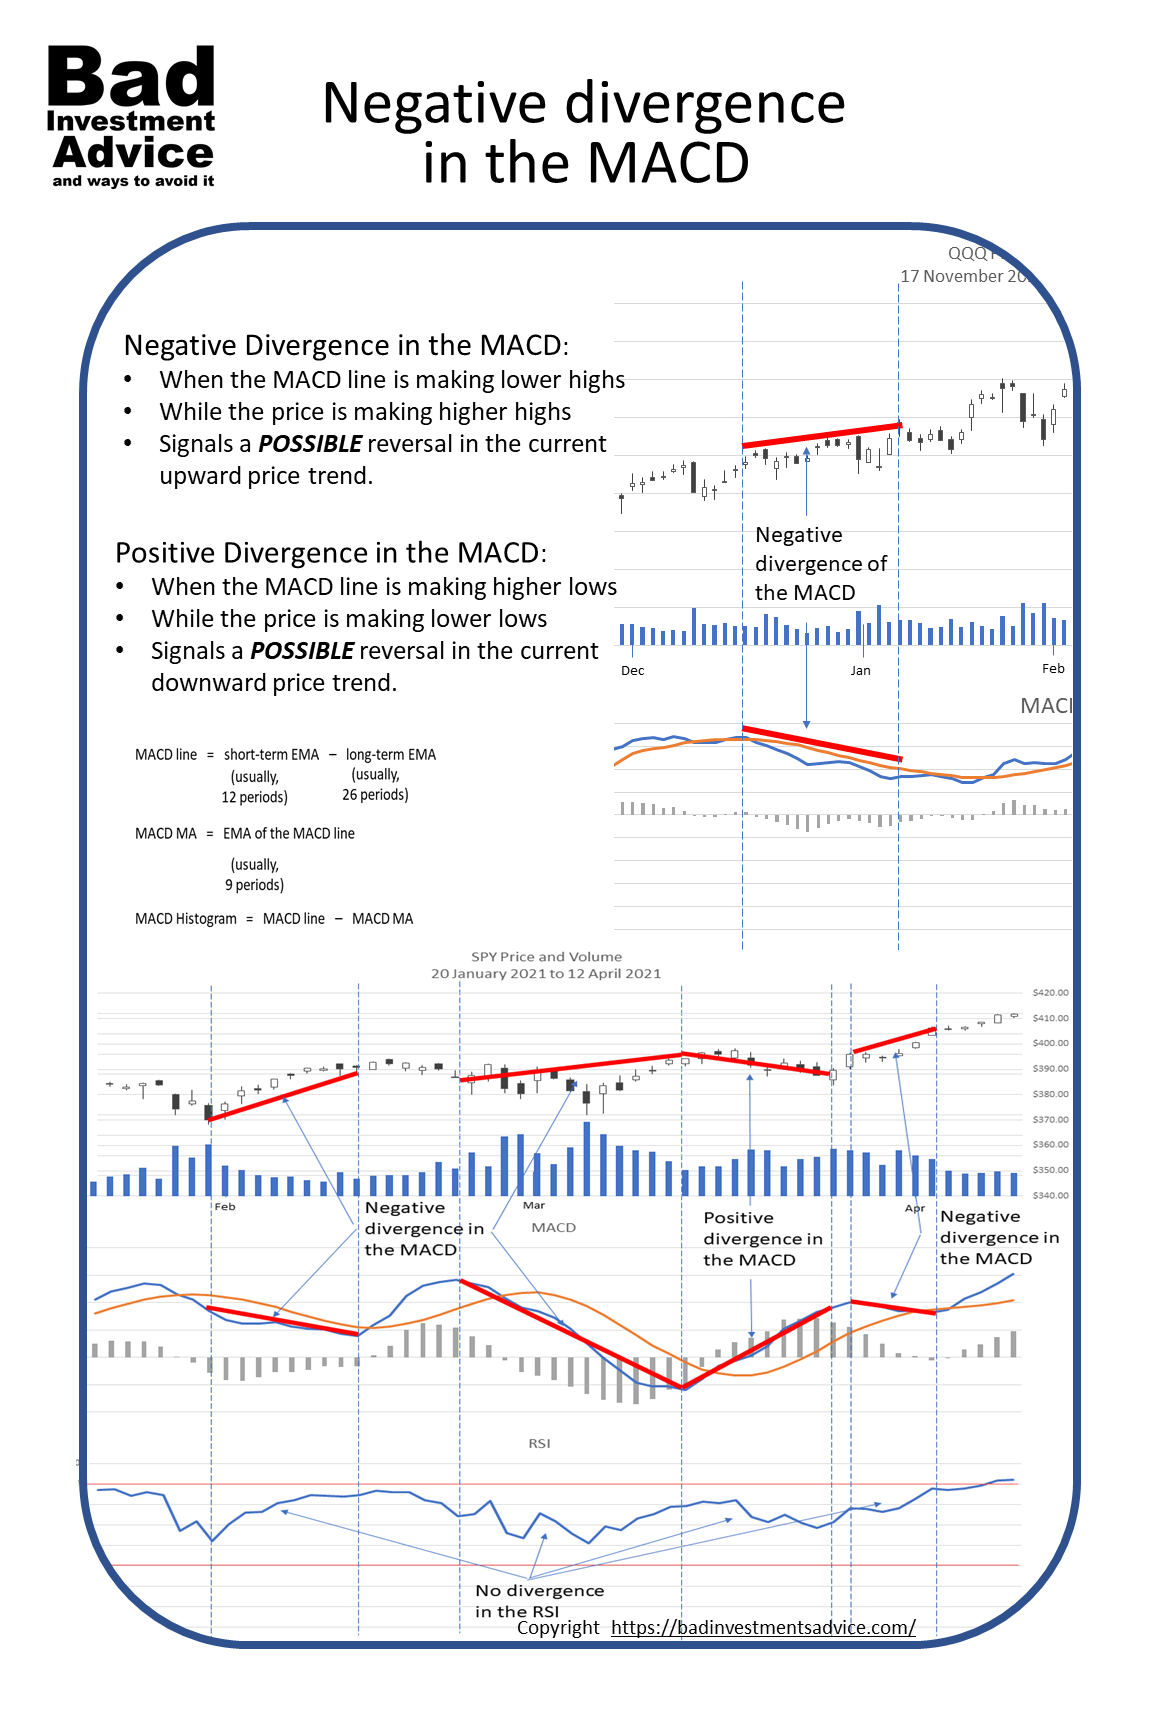
What is negative divergence in the MACD?
Negative divergence in the MACD is when the price of a stock or ETF is making higher highs but the MACD is making lower highs.
It is a bearish indicator in a price uptrend that signals the possibility or likelihood even of a downward reversal. More generally it is an indication that the price trend you are seeing is losing strength.

There is also positive divergence in the MACD which is effectively the reverse.
Positive divergence in the MACD is when the price is making lower lows while the MACD is making higher lows. Positive divergence in the MACD is a bullish signal that a downward trend in price that you are observing is weakening and may reverse.
If you are unfamiliar with the MACD, here is an article that explains how the MACD works.
Various kinds of divergence
In general, divergence in technical analysis refers to a situation where you observe a price trend while an indicator is telling you the opposite.
The two indicators most commonly used for spotting divergence are the RSI and the MACD. We do need to be careful though. Positive or negative divergence seen between price and these two indicators should only be considered as one possible technical analysis factor.
It would likely be a big mistake to make trade entrance and exit decisions only on the basis of positive or negative divergence observed in either the MACD or the RSI. We will sometimes see these signals but then there is no subsequent price trend reversal. In a similar way, there will be price reversals that take place without being foretold by positive or negative divergence in the MACD or the RSI.
So if we are only looking for a price reversal, these signals can be both false positives and false negatives.
What is the MACD actually telling us?
It is important to remember what the MACD is actually telling us.
The MACD stands for Moving Average Convergence Divergence. So it is a way of displaying whether two movings averages, one shorter-term and one longer-term, are converging or diverging. The MACD is an oscillator. It moves up and down around a zero centerline.
The moving averages chosen by default in most technical analysis tools are a 12-day exponential moving average, or EMA, and a 26-day EMA. The MACD line is generated by subtracting the slower-moving 26-day EMA from the faster-moving 12-day EMA.
We then create a 9-day EMA of the MACD line. Crossovers of the MACD line with its own 9-day moving average can be seen as buy and sell signals. The last refinement is to add a histogram that shows the difference between the MACD line and its own 9-day moving average. Here are the formulae.

And here is what it looks like for the popular NASDAQ composite-100 index-tracking ETF with the symbol QQQ from mid-November 2020 to mid-April 2021.

1)Source: Historical price data: Yahoo Finance, all calculations and charts by Bad Investment Advice.
If we think about it when the MACD line is moving up while it is already above the zero centerline, that means that the 12-day moving average is moving higher than the 26-day moving average. Or we can say that the moving averages are diverging. This is an indication that there is momentum building behind an upward price movement.

We can make a similar observation if the MACD line is moving down while it is already below the zero centerline. That means that the 12-day moving average is moving lower than the 26-day moving average. Thus the two moving averages are also diverging. This is an indication that momentum is building behind a downward price movement.

To complete the picture, we can also consider when the MACD line is moving towards the zero centerline, the two moving averages are converging. That is an indication that momentum in whatever price movement we are observing is declining.

Comparing MACD with price, negative divergence
Now we have reminded ourselves what the MACD is showing, what does negative divergence in the MACD look like? As always the best is to look at some examples.

The point to bear in mind is that highs and lows in price, in moving averages, and in indicators like the MACD derived from price moving averages are significant turning points.
They represent points where the tug of war between buyers and sellers has made an albeit temporary change in direction. And while the MACD line shows a divergence in the two moving averages by moving away from the zero line when we say – negative divergence of the MACD – we mean the MACD is making lower highs, when the price is making higher highs.
This is another way of saying that while the price has managed to move to a higher peak, the MACD made a lower peak, thus there is less momentum behind this higher price move. This is why negative divergence in the MACD is a bearish signal.
Having said that, we should note that the example of negative divergence in the MACD that we have chosen here did not foretell an immediate price reversal in the upward trend.
Positive divergence of the MACD
Positive divergence of the MACD is a bit like negative divergence but upsidedown.
Once again, positive divergence in the MACD is a bullish signal. While the price is making lower lows, the MACD is making higher lows.

Again, we could find many instances of reversals from a price downtrend that were not foretold by positive divergence in the MACD. Similarly, we can find a positive divergence in the MACD that does not result in a reversal of a price downtrend.
Another way of saying this is that positive and negative divergence in the MACD will both give false positive and false negative signals. As we noted above, our example of negative divergence in the MACD did not lead to a price reversal.
So why bother?
The answer is that we shouldn’t be looking for simplistic mechanisms with technical analysis anyway. In technical analysis, we need to consider a number of indicators to see whether they all confirm a similar conclusion.
If a variety of indicators point to conflicting or inconsistent conclusions about where the price is likely to head, then the best thing to do is back off.
But before we completely abandon positive and negative divergence in the MACD, let’s look at the same phenomenon with the RSI
What about the RSI
First, we should remind ourselves what the RSI is actually showing us. This article explains how the RSI is calculated.
Another way of understanding the RSI is to think of it as a number that moves between a theoretical minimum of 0 and a maximum of 100. And this number compares the average of the intra-period price increases with the average of the intra-period price decreases during a specific number of periods.
The RSI is usually calculated using 14 periods.
So while both the MACD and the RSI are oscillators that show us something about the strength and momentum of price movement, they are measuring and displaying different things.
The MACD vs the RSI
The MACD is measuring the trend in differences between a short-term and a longer-term moving average and could therefore mathematically at least be indifferent to the difference between the closing prices on the periods in between.
The RSI on the other hand makes a comparison between the average up-moves in a period with the average down-moves in a period and could in theory be indifferent to how the average price over that whole period has moved.
Divergence in the RSI
Divergence in the RSI looks the same as divergence in the MACD. Here are some examples when we add the RSI to the chart we already have.

Here we can see a very slight indication of negative divergence in the RSI. I am not able to spot any positive divergence in this chart. So let’s take a look at another chart.
This is the price and volume chart of Rural Electrification Limited, symbol RECL. This is a company involved in the financing of electrical infrastructure in rural areas. This is from the period November 2018 to September 2019. For the sake of completeness, we can include the MACD.

In late July 2019, we can see a positive divergence in the RSI. The RSI made higher lows while the price was making lower lows. This would have suggested that the price could reverse its decline to the upside. We should note that didn’t happen. So it was a false positive.
Let’s take a look at another example. Here is the price and volume data for the Standard and Poor’s 500 Index tracking ETF, symbol SPY. This is showing the period 20 January 2021 to 12 April 2021 and includes the MACD and the RSI.
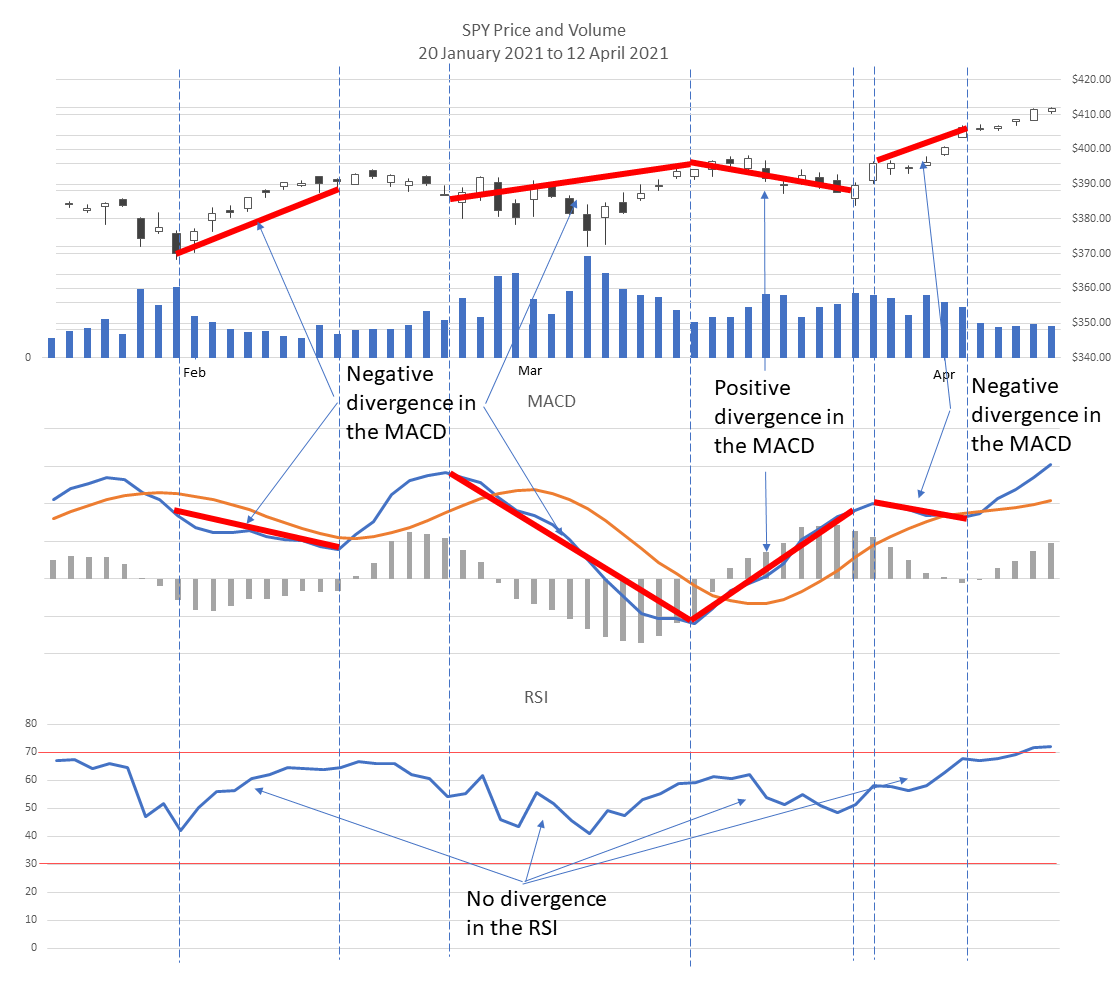
This is interesting. Here we see instances of negative and positive divergence in the MACD none of which are matched by divergence in the RSI. In this case, we can see that the MACD was often indicating that a price trend reversal was possible, and in some instances that did occur.
Thinking back on the past few months, this has been a choppy period in the markets. It is not surprising that indicators show conflicting or inconclusive signals.
Divergence in both the MACD and the RSI
We have already found separate instances where divergence in the MACD or in the RSI can be both false positive and false negative signals. I went looking for instances of either positive or negative divergence in both and so far I have not been able to find any. But I probably just have to look harder.
Conclusion
I don’t think there are any great conclusions to be drawn from this examination of negative divergence in the MACD and divergence in both the MACD and the RSI in general.
I think we have demonstrated the conventional wisdom that divergence in either of these indicators is just one tool in our technical analysis toolbox and it would be unwise to rely on it for signals. Though divergence can be used as a means of confirming other signals that we are seeing.
Here is an excellent reference article on the MACD.
Questions and answers
Q. How accurate is MACD divergence?
A. MACD divergence should be considered as one of many tools in technical analysis. We have demonstrated here that divergence in the MACD is not always an accurate signal of a price trend reversal.
Q. What does negative MACD mean?
A. Because the MACD is the difference between a short-term moving average and a long-term moving average, negative MACD is when the shorter-term moving average is lower than the long-term moving average. If the MACD line is moving even lower below the zero centreline, then this is a general indication that downward price momentum is getting stronger.
Q. What is negative divergence for RSI?
A. Negative divergence for the RSI is when the RSI is making lower highs while the price is making higher highs. It is an indication that the strength of the upward price movement is dwindling.
Affiliate Disclosure: This article contains affiliate links, if you purchase through a link on this site, I may receive a commission.
Are you ready to get serious about investing in your own financial education? Then check out membership of the American Association of Individual Investors, the AAII.
The AAII is a nonprofit organization, dedicated to the financial education of its members. Your membership of the AAII will give you access to courses and resources on stock investing, financial planning, and how to manage your retirement finances.
Single-page summary
Here is a single-page PDF summary of divergence in the MACD.
I hope you found this article interesting and useful. Do leave me a comment, a question, an opinion, or a suggestion and I will reply soonest. And if you are inclined to do me a favor, scroll down a bit and click on one of the social media buttons, and share it with your friends. They may just thank you for it.
You can also subscribe to email notifications. We will send you a short email when a new post is published.
Disclaimer: I am not a financial professional. All the information on this website and in this article is for information purposes only and should not be taken as personalized investment advice, good or bad. You should check with your financial advisor before making any investment decisions to ensure they are suitable for you.
Affiliate Disclosure: This article contains affiliate links. If you click on a link and buy something, I may receive a commission. You will pay no more so please go ahead and feel free to make a purchase. Thank you
References
| ↑1 | Source: Historical price data: Yahoo Finance, all calculations and charts by Bad Investment Advice. |
|---|
The stock market analyst I trust tells me that this negative divergence means we’re at risk of going down and it can’t go up anymore, so they say you should sell now before everything crashes because these indicators are telling us something bad’s coming our way!
I’m not the type of person who likes to make decisions based on what other people do. For me, it’s all about finding your own path and setting goals for yourself. That being said, I don’t like negative divergence in the MACD because it doesn’t necessarily mean that a reversal is coming any time soon or at all.
Hi and thanks for your comment. Negative divergence in the MACD can be inconclusive as this article has demonstrated. But that is where remembering what the MACD is actually showing is relevant. Best regards, Andy
Hi Andy, pleased to meet you. I went through your article on negative divergence in MACD. I found it very educative and informative too. But I would like to ask, what causes this conflict between what we observe and what the indicator tells, I thought they have to go in the same direction? Anyway thanks for sharing this amazing post with us. Sharing is caring, right?
Hi Kokontala, that is an interesting question and has many aspects. The divergence between an indicator and the price will have many causes. Firstly we should remember that each indicator is derived from the price. Both the MACD and the RSI are just mathematical manipulations and representations of what price has recently been doing. Both are lagging indicators. So the lag itself can be a source of divergence. I think that the point to consider with divergence is that it is showing a different direction. Indicators are more often than not going to be showing the same direction but to a different degree. And that degree can represent either the strength of a move or the velocity of a move or the momentum behind a move. When the direction of an indicator is showing divergence in direction vis a vis the price, then that is more than just the degree. Perhaps it isn’t something to get overwound about, but just to have it as one of many tools in our toolbox, or weapons in our arsenal if you prefer that metaphor. Thanks again for the question. Best regards, Andy
Hi, Andy!
Glad to see your introduction about What is negative divergence in the MACD.
Obviously, this is a very professional article about MACD. I’m sure you must be an experienced person in this industry.
I am not investing in stocks or ETF, myself. If I dabble in this area in the future, I will think of your introduction.
It’s a great article, thank you!
Harry
Hi and thanks for your positive comment. Best regards, Andy
Thank you so much for your article. I am very new to investment terminology, so some of the acronyms you used I had to look up, but I really appreciate the insight. I definitely learned a lot just by reading everything you posted. Please continue your work as it is much needed!
Hi and thanks for the positive feedback. I am glad that you found the article interesting. Best regards, Andy
Interesting article on the use of MACD. I must say I totally agree. I use the MACD to trade crypto. I will only use it to keep me out of a trade as opposed to confirm a trade. I only use the MACD line on my charts. I turn off the histogram & signal and only have the one line displayed. (I like clean charts)
For me, the MACD MUST be in agreeance with the price. If it is not, I don’t have a trade. This will keep me out.
Hi Dave and thanks for the comment. I tend to use the RSI more myself. That is actually very interesting that you use the MACD mainly to keep you out of trades. I will have to look into that more closely. Thanks for the comment and best regards, Andy
Hi, thanks for this article about What is negative divergence in the MACD. I am also a trader and I have heard about the MACD before but never really used it in my trades. I use the RSI, EMA, and Bolinger bands. But with the RSI I can also look for divergence. I agree with you that the MACD like other indicators does not give accurate information about the market behavior that why in my opinion it should be used together with other indicators like the Bolinger bands and moving averages.
I. I am like you. I use the RSI and moving averages. I’ve looked at Bolinger bands from time to time but I find that price, volume, past levels of support and resistance, moving averages, and RSI are enough. I have looked at the MACD from time to time but since I already use two or sometimes three moving averages, I can pretty well see the trends between them. Thanks for your comment and I wish you all success with your trading. Best regards, Andy
It seems like negative divergence can really cause big impacts on her investments or what we speculates with. Either way I must admit that your content is very educational and has been very helpful to me. Thank you so much for teaching everything that you teach on this website it is truly amazing
Hi and thanks for the positive comment. I think we should remember that divergence in the MACD is really showing a deceleration of the trend. That does not necessarily mean an imminent reversal. I hope this helps clarify. Best regards, Andy