Spoiler alert! if there is anyone who wants to save the answer to the question, what does the capital asset pricing model do? to the end of this article, then close your eyes or cover up the next paragraph or just quickly scroll down. Here it is:
The Capital Asset Pricing Model is a model used to determine the theoretical price and expected return of a stock taking into account the additional risk that the stock has above the risk of the rest of the market.
There are assumptions behind the statement above and looking into those assumptions gives a good understanding of what the Capital Asset Pricing Model, CAPM for short really does.
We should note that after the CAPM was introduced in 1961 it has drawn a lot of criticism and there have been refinements to the model. Nevertheless, and notwithstanding Nobel Prizes in Economics for some of those involved and in spite of the criticisms, the CAPM remains popular because of its ease of use and wide applicability.

Systematic risk, market risk, non-diversifiable risk, and idiosyncratic risk
That all sounds very complicated, but actually systematic risk, market risk and non-diversifiable risk are all the same thing or rather refer to the same component of the risk of a stock.
Let’s remember that risk is just a measure of the variability of the actual return we will receive from an investment with respect to the expected return from that investment. A high-risk investment has a high variability of return and a low-risk investment has a low variability of return.
The other risk component of a stock is the idiosyncratic risk of the stock. Unsurprisingly, the idiosyncratic risk is that part of risk specific to a stock that is not part of the market risk. Very simply this is what it would look like.

The systematic risk is risk that the whole market is subject to. So this would include risks of all the vagaries and things that go either right or wrong in the economy or with the weather or international trade for example. It is also non-diversifiable because it is part of the risk that you can’t get rid of by diversifying into other investments.
Beta
One of the variables that figure into the CAPM calculation is Beta. The Beta of a stock is the measure of how the stock price moves in relation to market price movements. This is easiest to see with a few examples.
- If the market rises or falls 1% and the stock price rises or falls 1% i.e. the stock price moves in step with the market then Beta of the stock is 1
- If the market rises or falls 1% and the stock price rises or falls 0.5% i.e. the stock price moves in the same direction as the market but by half as much, then the Beta of the stock is 0.5
- If the market rises or falls 1% and the stock price falls or rises 0.5% i.e. the stock price moves in the opposite direction as the market and by half as much, then the Beta of the stock is minus 0.5
- if the stock price movements have no correlation with market price movements, then the Beta of the stock is zero.
Many investors who have used Beta will know that it only works for small percentage movements in both market and stock prices. Once a price movement goes beyond a few percentage points, Beta no longer works, or rather even though a correlation of price movements may still be present it would not be expressed by a single static number.
Other variables and assumptions used by CAPM
The rate of return of a theoretical risk-free asset. The closest that comes to the return of a risk-free asset would be the return on a bond that pays back the principal and interest with absolute certainty even if the world went to hell in a handbasket. For practical purposes, a 10-year Treasury bond comes closest and can be used as a substitute.
The expected return of the market. For practical purposes, this is best represented by the average long-term return of the Standard and Poor’s 500 index.
Normal distribution of returns. The CAPM assumes that the rates of return of both the market and the stock statistically follow a normal distribution, with a mean value and an even deviation either side of that mean.
Zero transaction costs. The CAPM also assumes that diversification can be achieved with zero transaction costs to completely eliminate the idiosyncratic risk of the stock in question.
The outcome of the assumptions
The assumptions upon which the CAPM is built essentially mean that the appropriate theoretical price of a stock is determined by its Beta. So once we know the Beta of a stock, the expected market return, the expected return of a risk-free asset we would be in a position to determine the theoretical expected return of the stock and hence its theoretical price.
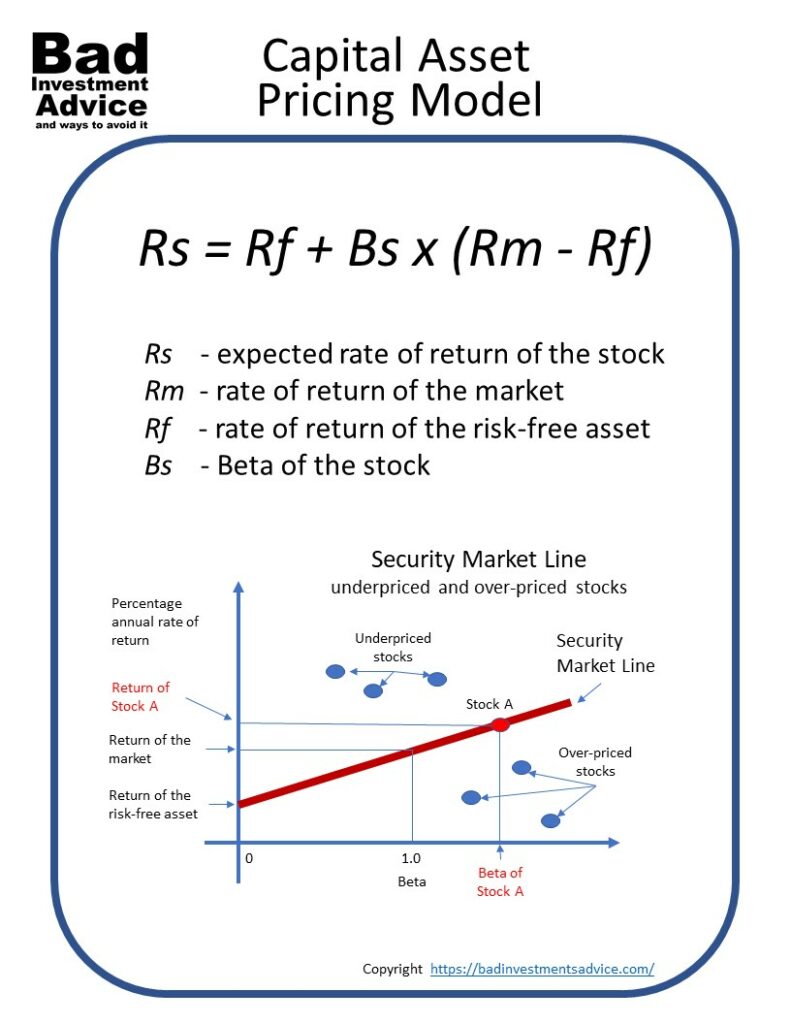
The Security Market Line
The CAPM assumes a linear relationship between its variables and is expressed as the Security Market Line as shown here.

So what this means is that the appropriate rate of return of a stock would be placed anywhere along the Security Market Line and that rate of return would determine the appropriate theoretical price for the stock. This also means that any stock whose Beta and rate of return place it above the Security Market Line would be currently underpriced and any stock under the Security Market Line would be currently over-priced.

The CAPM calculation
Here is the formula for the CAPM arranged to calculate the theoretically expected rate of return of an asset if its Beta is known. The variables are
Rs – is the expected rate of return of the stock
Rm – is the rate of return of the market
Rf – is the rate of return of the risk-free asset
Bs – is the Beta of the stock

We should note that to make the formula work, Rm, the expected rate of return of the market should be a historical average, usually, the long-term average return of the Standard and Poor’s 500 index, and Rf the rate of return of the risk-free asset should be a historical average of the 10-year Treasury bond. For it all to make sense all these rates of return should be annual.
Uses of the CAPM
The CAPM is often used in conjunction with fundamental analysis and technical analysis to determine whether a stock should be included in an investment portfolio.
The CAPM can also be used to calculate the expected return of a portfolio of stocks.
This artile explains more about the history and variants of the Capital Asset Pricing Model.
If you are curious about how financial derivatives pricing models, here is an article on the Black Scholes pricing model.
Here is a PDF summary of the Capital Asset Pricing Model.
I hope you found this article interesting and useful. Do leave me a comment, a question, an opinion or a suggestion and I will reply soonest. And if you are inclined to do me a favor, scroll down a bit and click on one of the social media buttons and share it with your friends. They may just thank you for it
Disclaimer: I am not a financial professional. All the information on this website and in this article is for information purposes only and should not be taken as investment advice, good or bad.
Affiliate Disclosure: This article contains affiliate links. If you click on a link and buy something, I may receive a commission. You will pay no more so please go ahead and feel free to make a purchase. Thank you!
Hi Andy,
You seem to be an expert in this field. It is the first time that I understand about The Capital Asset Pricing Model. Despite that some ideas were difficult for me but I got the whole ideas.
It is the first time that I understand the expression Beta of stock which means the measure of how the stock price moves in relation to market price movements.
In my opinion, it is not only the criteria Beta, but there are also other factors. I know that some marketers can do secret things that help to raise or lower the prices suddenly
Have a great weekend
Rania
Hi Rania
Indeed you are right. Beta is not the only measure of interest in a stock by a long shot. It is really only a very limited indicator of small price movements. Thanks for your comment.
Kind regards
Andy
I have been learning about this idiosyncratic risk and your post has helped me to clarify several points. And I now know that I have to spend time studying each stock, because this risk, naturally, varies from one stock to another.
I initially put in the same pot the systematic and the idiosyncratic risk. What a mistake.
Hi Ann and thanks for the comment. Yes, this is a very important distinction. If there is one problem with the simplified mathematics used to derive beta, other parameters, and draw conclusions it is that these only work for small percentage price changes. It today’s markets where we often get larger movements, rigid rules break down. Still, understanding the distinction between systematic and idiosyncratic risk remains very important as you say. Best regards, Andy
First of all, what a clever website name! Definitely a head turner. I love it. This was a super helpful article for figuring out what on earth to do in terms of stocks. I find stocks a bit intimidating due to charts and graphs just like the Capital Asset Pricing Model, but after they’re explained to me so nicely like it was here, I feel a lot more confident. I’ve never been a fan of the method of just chucking some cash in a mutual fund and calling it a day. I think if you plan to invest, you should mean it more than that. Thanks for the great info!
Hi Maria and thanks for your comment. I guess the website name was my attempt at a get-out-of-jail-free card but also seriously I have heard so much bad advice over the years hence the name and the theme. I am very glad you found the article interesting and easy to follow. I hope you drop by again. Best regards, Andy
I studied some financial markets notions as part of my degree in Business and Economics (even though it focused more on managerial skills, marketing, accounting etc.). Lately, I have started to invest in some online trading platforms so I am studying finance again to make better investment decisions. Even though nobody can estimate risks perfectly (or we would all be millionaires :D) these models can surely help a lot once you understand how to use them.
Hi Horatius and thanks for the comment. Indeed the models are useful but have their limitations. Of course, the CAPM is more a valuation and risk assessment model than a price prediction model. Prices are so much swayed by money sloshing around in the markets you wonder whether a stock price will ever reach a valuation that reflects the fundamentals. I wish you all good fortune in your investing endeavors. Best regards, Andy
Hi Andy,
thanks for breaking it down into language we can all understand. I often stay away from stocks and stuff because it always seem way too complicated. So thanks for clarifying the different elements and helping me to understand it a little better. I noticed a couple more of your posts, so will be going and reading some of them to help me further.
thanks again
Hi John and thanks for your comment. I am glad you found it interesting and I hope an easy read. Please do check out the other posts here and I hope you find the information also interesting and useful. Best regards, Andy
Hey,
i really liked this site. i had a lot of question about capital asset pricing and when i came across this article all my major doubts were cleared. information is really nicely given and is quite clear. i would recommend everyone reading this review to go through this site once. i m sure you would not regret it.
Regards
Aparna
Hi Aparna
Thanks for your comment and I am glad you found the article easy to understand and interesting. Please do come back and if you have any questions or uncertainties, don’t hesitate to ask.
Best regards
Andy
I’ve learned about capital asset pricing model at my university while I was studying economics. This formula is basic and anyone with basic knowledge of math can comperhend it. It is essential for anyone who wants to dive into trading. I think this is the way to go when it comes to trading and stocks.
Your knowledge can not be replaced with some “super machine” giving you information about investment. At least thats just me.
Hi and thank you for the comment. I agree with you completely. There are so many personal factors about investing that you need to consider that there is no machine that could or should take it over from you. One of the most important investment decisions and actions we can take is to invest in our own knowledge about investing. Thanks and best regards, Andy
You have no idea how much your post has helped me in understanding and simplifying this idiosyncratic risk because of the variations that apply, studying the differences for each stock, and what really makes the process of understanding risk and reward possible. I really appreciate what you have shared here, it is really great. Thanks so much
Hi and thanks for your comment. I am very glad that you found this useful. Best regards, Andy
Hi Andy,
I am quite rusty to the terms of finance and investment so it was pretty dense to read it, but I found it really interesting. But just for the matter of recap, correct me if I am wrong:
The process to determine the prices of a stock is based on historical parameters that are relatively constant to assume some predictability on those terms. Man I don’t even know what I am saying.
Okay so I read your spoiler and I completely forgot about the risk aspect. I have a question now. If the Beta is an indicator of the stock price movements in respect to the market price movements, does that mean that if a stock has a estimated price that is coherent with the security market line (meaning it is on the red line from the graphic), then it has no idiosyncratic risks?
Also to clarify, when a stock is under-priced, it has a high annual rate return. Does that mean it is a stock with high or low idiosyncratic risk? Or am I relating wrong concepts?
Hi Duvan
Thanks for the questions.
To your first point about the process of determining the price of a stock, there are multiple ways to look at that. Here are a few simple statements. Supply and demand will determine the market price. Fundamental analysis will determine an appropriate or intrinsic price and the capital asset pricing model will assist in working out what the theoretical stock price should be based on its risk and reward features with respect to the market and baseline interest rates. Technical analysis will look at the history of price movements and can be used to make a judgement whether the current price is likely to rise or fall over various time periods into the future.
Then to your next point. Following the efficient market hypothesis, the appropriate or theoretical price for a stock is found along the security market line according to its beta. Because of market demand and supply it is very likely that the stock will be somewhere else and not on the security market line.
A stock only has systematic risk and no idiosyncratic risk if it has a beta of 1. If a stock has a beta of 1 then its price moves in lockstep with the market so it is only responding to systematic i.e. market risk factors and therefore does not exhibit idiosyncratic risk behaviour.
If a stock is underpriced in terms of its risk-reward parameters that just means that its annual return is higher than its risk would normally merit in any given market and economic conditions. The stock itself could have high or low idiosyncratic risk.
Thanks again for your questions and I hope this helps.
Best regards
Andy
Hi Andy, I’ve heard a bit about this model in my business admin course years ago, but it was never explained in such detailed clarity – and wit! You helped me get the concept of Beta (in my simplistic terms: Stock price is dependent on market price, (did I get it right?), and the fact that when a movement of price reaches a threshold over a few percentage points, Beta will stop working. Thanks for making the usually rather ‘dry’ topic so engaging!
Hi Lucie, thanks for the comment. Yes, another way of saying the main point of the article is that the theoretical price of a stock will adjust so that the expected return vs the risk of the stock falls into a linear relationship with the expected return vs the risk of the market and the expected return of a risk-free asset. Thanks again for your comment. Best regards, Andy
Thank you for your post. It is useful and educational for me. I am interested in stock market and always want to make money in stock trading. Most of what I read on this subject is just words. Few others give quantitative data like you describe here.
It is so nice to use the formula you present and to see the expected rate of return of the stock. The formula is powerful. You already gave detailed instructions on how to determine the values of individual parameters. I would like to see how do you get the values from particular stocks, such as Amazon. With your examples, I may be able to extend the stocks I am interested in.
It is a nice article and I continue in my search for the holy grail of stock trading guidance.
Hi and thank you for your comment and question. As regards Amazon, according to published statistics, Amazon’s beta is 1.6. If we take the current expected return on a 10-year Treasury, 1.21% as the risk-free return, and the expected market return as 12.21%, then the expected return for Amazon would be 18.53%. Amazon’s current earnings per share is $20.934, its stock price is around $2,700 and it’s P/E is 128. So are far as the CAPM is concerned Amazon is way off the charts by a factor of over 20 times. One thing is clear – Amazon is one of the mega-companies leading the Technology Sector which has led the bull market over the last few years. So there are other explanations for its very high valuation. Thanks for a great question, best regards, Andy
I never had much success investing in the stock market, and after reading your post, I now know why. I never paid attention to the Capital Asset Pricing Model (CAPM). Now I will be a wiser investor in the future knowing what to look for in stocks and not buying it because it is a well-known company.
When a company first entered the stock market, do they use the Capital Asset Pricing Model to determine the price of the company’s stock will be first listed?
Hi and thanks for your comment and question. Clearly there is much more than can be said about beta and the capital asset pricing model. Firstly there is a tendency over time for the beta’s of companies to regress towards the market i.e. 1. One thing that the CAPM does reinforce in investing is the central importance of risk management and that a company may be well-known has nothing to do with its risk-reward characteristics.
As regards trying to use the CAPM to determine the price of a newly listed company, it is a part of the analysis. However, there is no market price history available to calculate beta. There are two possible approaches used. Either beta’s of comparable listed companies can be used. That can be very difficult as there may not be a comparable listed company with very similar operations and financial structure so analysts may try to use a mix of listed companies from the same industry. An alternative approach is to try to set up the historical earnings of the company being listed. That may also be difficult because of the lack of reliable historical information.
When it comes down to it an estimated beta at an IPO launch is a bit of a guess. The case built around the price of a stock at IPO launch is more founded on its operations and its competitive position in the market for its products and services, rather than how the stock price will perform with respect to market price movements.
Thanks again for the excellent question.
Thank you for this amazing article, I’ve always been interesting in learning more about the stock market and how to make wise investment, but I’ve been acting so lazy that I never find enough time to do so. Your article give me the desire to finally take time to start study the stock market.
Hi and thank you for your comment. I am very glad you found the article interesting and I hope useful. I wish you all success on your investing journey. Best regards, Andy
My interest in the stock market has always been there though I have been extremely lazy when it comes to doing the reading that is required to get started with the knowledge. This post has actually given me more diversified knowledge and the right boost on how to go about it and I really appreciate that. I also like the break down of the idiosyncratic risk.
Hi and thanks for your comment. I am glad you found it interesting and I hope useful. You should find that some of the other articles are also useful. I would suggest this would be a good place to start.
https://badinvestmentsadvice.com/how-to-begin-investing-in-stocks-steps-to-take-before-you-invest/
Best regards, Andy