There are many styles and approaches to trading stocks. But unless you make an effort to learn how to do technical analysis of stocks your chances of making gains on short term trades will be poor.
Technical analysis is a big topic and there are many techniques involved. This two-part introduction looks at the main features and puts technical analysis in perspective with other aspects of investing.
Broadly speaking the other main pillars of investing analysis are fundamental analysis and quantitative analysis
Technical analysis – what it is
Here is a more or less textbook definition of technical analysis:
Technical analysis studies past and current price and volume data and looks for patterns and clues to future price movement. The intention is to reduce or eliminate emotions such as greed, fear, or the effects of hype from trading decisions. The process of technical analysis involves collecting as much evidence as possible about a price trend by studying its behavior, then identifying the reversal of the trend. What technical analyst is really looking at is patterns of human behavior reflected in price movements.
The accepted wisdom is that technical analysis should be used in concert with fundamental analysis and that technical analysis tends to lead fundamentals.
When you use the techniques of technical analysis not only are you trying to find patterns in price movements that reveal herd behavior but you are also trying to bypass your own emotions so you don’t get drawn into following the herd.
Because technical analysis is used to assist trading and investing decisions aimed at a relatively short time horizon rather than building a long term value portfolio, the only way to beat the herd is to be ahead of the herd. Whereas our emotions will tend to prompt trading and investing action that follows the herd.
Charting – looking for our course
Technical analysis makes use of charts showing price and volume movement over time. Some charts make it easier to see longer-term trends while others are better suited to viewing shorter-term periods.
Line charts plot price changes of a specific stock fund or index over time, usually recording the closing price on any day week or month as a single point on the chart and then joining up all the points with a line. This cuts out the noise of all the price variations that may happen during the period. Line charts tend to be more useful showing price trends over many months or more. But the strengths of line charts can also be weaknesses.
Line charts will not reveal the strength of a price movement. They will also not show up gaps between trading periods. This is more of a problem with short term views if a line chart is used to view daily prices. The line chart will not reveal those instances where a price opened the next day outside the price range of the previous day. Such price gaps can occur when news or events happen outside trading hours. So you really want to know about price gaps if you are looking into trading a particular stock.
The two most popular charts which capture the significant price points during a trading period are the candlestick chart and the Open, High, Low, Close or OHLC charts.
- There are many variants of these charts but these are the main ones in use.
They are best explained with examples. Below is
- a line chart,
- a candlestick chart, and
- an OHLC chart
for the State Street Global Advisors Funds, Standard and Poor’s 500 Depository Receipt fund which goes by the symbol SPY for the same time ten-day period ending on 18 May 2020.
Straight away we can see there is more information on the OHLC and candlestick charts than on the line chart. Without laboring the point, the OHLC and candlestick charts gives the same information just in a different way. Whichever one you use is just a matter of personal preference. Here are the price points shown in the two charts.
Trading Volume
In order to get a better handle on price movements, we need to know the trading volume. The higher the volume the stronger and more durable the price movement. Conversely, when prices move in thin i.e. low volume trading any gains or losses are more easily reversed when more traders are active in the market.
Low volume trading often happens around holidays. On the flip side, high volume trading happens when there is either strong bullish trading and many buyers are driving up prices or when many sellers are driving down prices. This is what the same ten-day chart looks like with the trading volume displayed below.
In addition to considering trading volume technical analysis makes extensive use of moving averages to gain an understanding of price movement.
When the averages move
Comparing moving averages over different time horizons reveals much about price movements. Two commonly used moving averages are the 30 day and the 150-day moving averages. When the 30-day moving average goes below the 150-day average that is commonly seen as a buy signal, and when it moves above the 150-day average that is seen as a sell signal.
Because of the recent dramatic moves in the Standard and Poor’s 500 index, and the market as a whole, the 150-day moving average is far removed from prices over the ten-day period ending 18 May 2020. We need to look at a longer time frame to more readily see both lines. Here is the SPY 1-year chart ending 18 May 2020 showing the volume, the 30-day moving average, and the 150-day moving average.
Support and resistance
Because technical analysis seeks to discern evidence of human psychology in price movements, one of the basic assumptions is that traders are in a certain “head-space” or communal sentiment at any time until that sentiment changes. Assuming that we are a period of somewhat consistent sentiment then technical analysis seeks to identify levels of price support and price resistance.
When the price drops to the level of support, buy orders are triggered in sufficient numbers to drive the price back up. On the other side, where prices rise to a certain level sell orders are triggered in sufficient quantity to drive the price down and that is the level of resistance.
Most of the orders that set support and resistance levels will be sitting pending with brokers ready to execute when the price levels hit them. Effectively, support and resistance orders kick the price movement in the other direction.
However, either external events or market behavior can inspire or provoke a new order to be placed in large and rapid volume. That is when herd instinct, either driven by greed or by fear has taken over.
For the moment, if we consider periods where the same predominant market sentiment prevails, the market price will move between levels of support and resistance. That is until such time as the predominant market sentiment changes and the price breaks through support or resistance until it finds other levels of support and resistance.
Trends
A trend is either:
- upwards i.e. bullish,
- downwards i.e. bearish, or
- flat, sideways also called range-bound.
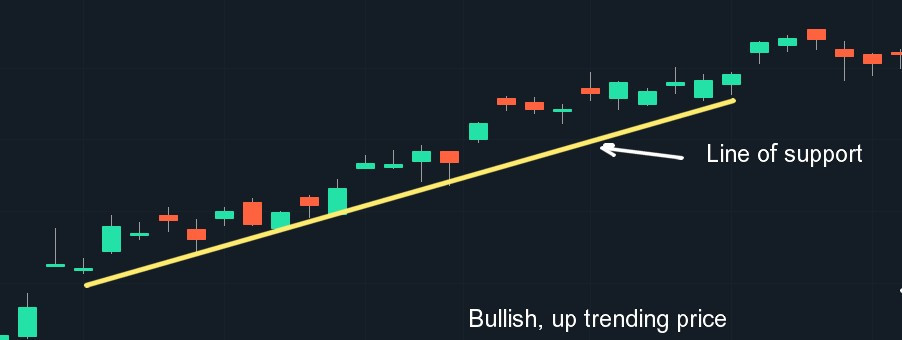
In a bullish or up-trending market, the price moves up in successive waves each peak higher than the previous peak with the line of support indicated by a line tracing the bottoms of the wave troughs.
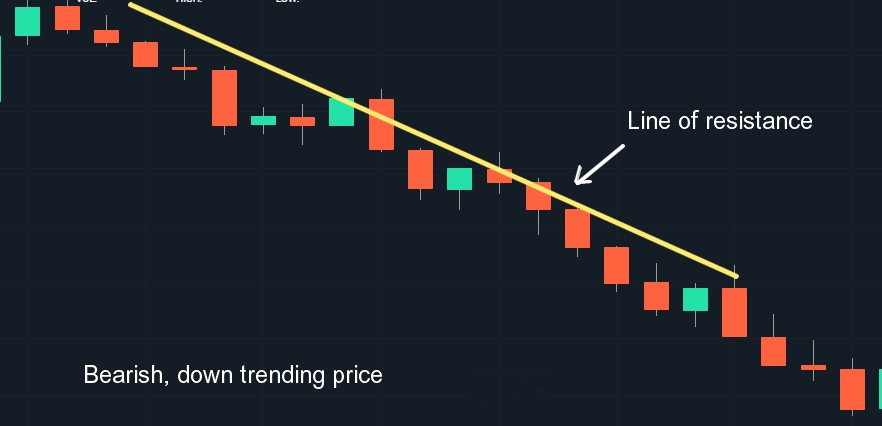
A bearish market or down trending market is characterized by successive waves of price movement where the peaks of each successive wave are lower than the previous peak. The line of resistance is shown by a line that traces the peaks of the price waves.
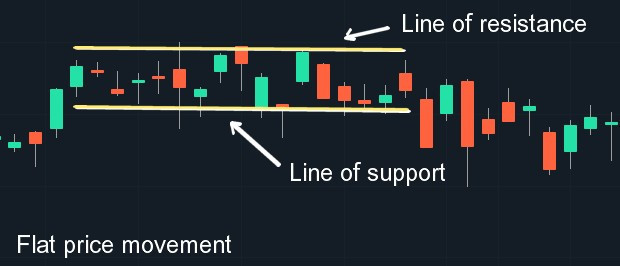
In a period of flat or sideways price movement, the price moves in waves within a range. The top of the range is the upper limit of resistance and the bottom of the range is the level of support.
Technical analysis is looking to find when a price trend starts, where there is a trend correction and when the trend is being reversed.
Bounce points
What tends to happen is that as prices move between support and resistance levels, they bounce against these barriers effectively weakening them until the price breaks through. Once either a support or resistance level has been broken the price will continue to move in that direction until it meets the next level or either resistance or support.
This is easiest to see if we look at one trend direction. Let’s take an upward trend.
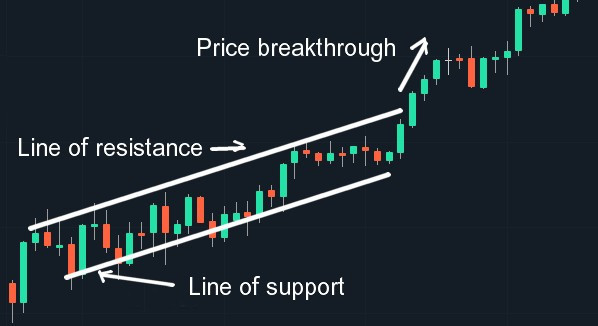
In an upward trending market, a resistance level has already been tested a couple of times and each time met it triggered a large enough volume of sell orders to send the price in a downward direction. But over time more buyers push the price back up again and at some point, the resistance level is broken and the price moves beyond and then further upwards.
As this continues what was the resistance level now becomes a new level of support.
Trend indicators
The meat and potatoes task of a technical analyst is pouring over price and volume charts, looking at moving averages and other visual clues trying to discern indicators of future price trends of either continuation, correction or reversal. This is in part mathematical and statistical but predominantly a visual task.
There are a number of indicators from single candles, double candles, and triple candle patterns. The most common and easiest to spot are the double top, double bottom and head, and shoulders, and inverted head and shoulders patterns. This is what they look like.


In part 2 of this introduction, we will focus on the longer-term patterns and examine other tools of technical analysis. Here is a link to part 2.
To find out more about the history of technical analysis, check here.
I hope you found the first part of this introduction to technical analysis interesting and useful. You can continue to part 2 here. Leave me a comment or any question and I will get back to you soonest. And if you really want to do me a favor, please share a link on your social network. You just have to scroll down a bit to find the buttons.
Affiliate Disclosure: This article contains affiliate links, if you purchase through a link on this site, I may receive a commission.
Are you ready to get serious about investing in your own financial education? Then check out membership of the American Association of Individual Investors, the AAII.
The AAII is a nonprofit organization, dedicated to the financial education of its members. Your membership of the AAII will give you access to courses and resources on stock investing, financial planning, and how to manage your retirement finances.
Affiliate Disclosure: This article contains affiliate links. If you click on a link and buy something, I may receive a commission. You will pay no more so please go ahead and feel free to make a purchase. Thank you!


Hi Andy,
I couldn’t have come across your article at a more opportune time! I recently tried trading in stocks, but though I caught up with the training pretty fast and did fairly well, I felt I needed more in-depth knowledge about technical analysis. I needed a deeper explanation. Otherwise I would continue making what my Coach called “crazy profits”, and then lose most of them!
Thanks very much because you have provided exactly what I needed!
Warmest regards.
Hi Teboho, thank you very much for your comments. I am very glad that you found the information helpful. Good like and may the Crazy Profits continue! Kind regards, Andy
Hello, thank you so much for this very detailed and informative post, What caught my attention first was your site name it’s really cool, I have some interest in trading stock but I haven’t really taken time to study how to do it. I have a general idea of what stock is, but this post has taken me a step further in knowing how to analyze stock price movements. This I must say is really profound material.
Thank you for your positive comments. Technical analysis is a voluminous subject. I am glad you found it interesting. Best regards, Andy
Hello there, a big thanks to you for sharing this insightful and informative post on how to do technical analysis of stock. Carrying out technical analysis of stocks has been a major challenge for me on my path which prompted me to research more on it. I really find this article useful and educating I have really learnt a lot. Thanks
Thank you for your positive and encouraging comments. I am pleased that you found the article useful. Please check out the other articles on technical analysis, fundamental analysis and quantitative analysis. Together these should give a broader overview of many aspects of investing in stocks. I wish you the best of luck, kind regards, Andy
Hello, This is a nice write-up here on how to do technical analysis on stocks. You talk about many interesting tools and models to analyse stock prices. I will read more and try to learn more on this subject that you are writing about. I must say you did a great job writing of such an informative article I enjoyed it and I did learn a lot from it, thanks for sharing.
Thanks for your comments. I hope you also find the other articles on this site useful. Please don’t hesitate to let me know if there is any particular related subject you would like covered. Thanks and best regards, Andy
Hello and thanks for sharing such amazing concise information with us all, I was actually doing some research online when I saw your post, your choice of words and writing skills is really something to write about, I really do find this very useful. I already saved these page so as to come back for future reference, thanks a lot for the info
I am glad that you found the article interesting and useful. I will be adding more articles on related topics and analysis tools shortly so do please come back and check out the latest. Thanks for your comment. Best regards, Andy
I feel many would like to get in to investments such as stocks and shares but are stopped because of a lack of knowledge.
People like yourself sharing this valuable information will be of a huge help to so many.
I have never known where to start when it comes to understanding this, but would certainly like to, and your article has sparked even more interest in me. I will definitely be bookmarking your site to return to. Lockdown is providing us with the perfect opportunity to learn new things, and you have just inspired me to give this a shot. Thank you
Hi Emma and thank you for your comment. The place to start with investing is to understand your own goals, your time horizon, your risk tolerance, your financial circumstances and whether you should use tax advantageous instruments. Very often if you are employed and your employer matches your contributions to a 401k the first best thing to do is take maximum advantage of that plan. You will find a number of other articles on this site that will help you ask yourself the right questions so you can make solid informed choices. Thanks again and best regards, Andy
Thank you so much for increasing my understanding of how things work within the stock trade and how I can be best positioned. I can see that reading the trends is crucial to profitable stock trading. Though I am of the view that that the services of experts be utilised when one is seriously considering an investment in this line of business, nevertheless I am more knowledgeable now. Your detailed analysis will be helpful for me in making an educated decision.
Hi Debbie, I agree with you that expert advice and services are useful and often the right choice for someone to make. Much depends on your own circumstances and how much you are willing to invest of your own time and apply discipline to investing activities. Expert services always come at a cost and those annual service fees compounded make a substantial difference to the sum you are able to amass. I think it makes sense to understand the investment strategy your expert is following and whether there are off-the-shelf funds you can invest in directly yourself that follow the same strategy. You then have to ask yourself whether the incremental cost of the expert services outperforms an off-the-shelf investment product by a sufficient margin to cover and exceed the cost of the expert’s annual fees. But I agree with you, for many people using expert services is the right choice. Kind regards, Andy
Every well done article and illustrated extremely well. I traded futures contracts for many years so I understanding charting. Also your illustration of support and resistance lines is very well done. The problem isn’t the charting, it’s people jumping in to a trade soon and not cutting their losses quickly enough as I’m sure you are quite well aware of. I may have missed it but didn’t notice if you wanted to mention Option trading or paper trading for beginners.
Hi Richard and thanks for your comment. I didn’t get into options trading or paper trading yet as I felt the article was already long enough as it is. In fact I wrote parts 1 and 2 as a single article first then realized it was too long so split it into two. Controlling emotions is so important and I think the best way to do that is to have a system and stick with it. That system is going to need to determine where you get in where and under what circumstances you get out and determine your stop loss order all before you get into a trade. I will get into those subjects in later articles. Thanks again and have a great day, Kind regards, Andy
i wanted to go into this stock exchange last, but one of the thing that got me back was the review on youtube, am a very frugal kind pf person and peradventure, they close the company or something happens. please I need a bit of advice on how to invest my money and the best place
thank you
Hi Jennifer, it sounds like you need to adopt a cautious and predictable approach. I would suggest that you check out some other articles here – maybe this one to begin with
https://badinvestmentsadvice.com/category/investment-and-personal-finance-related-topics/personal-finance/
and a few of the others. Don’t worry, as you can see there is no hard sell at all here and I’m not trying to sign you up for anything. Many of the articles are written on the assumption that the reader is looking to get into trading or active investing. If that is not the case and you are looking for a safe way to build savings over time, then I would seriously suggest you consider making regular payments of even less than a hundred dollars a month into a broad market indexed fund. Here is another article that looks at the long term results that could be expected.
https://badinvestmentsadvice.com/stock-market-returns-for-the-last-30-years-when-to-invest/
If you have any more questions on any of these then do leave me a comment and I would be pleased to respond. I wish you all success, have a great day, Kind regards, Andy
A great article. Please understand these are technical approaches on how to properly understand a graph. It took me 5 years before I started investing by myself, and later down the line, I learn the most advanced strategies. This article allowed you to tackle your doubts head-on, and also install some confidence in your choices before purchasing any share. I will strongly advise any new investor to take the time to read this article because it is a well-writen article. And yes the better you understand your investment the less likely that you will make a bad investment.
Thanks for engaging on this topic. And yes the focus of this article is technical understanding of price and volume charts. I fully agree with you that beginning investors should take the time to learn as much as they can to build confidence and knowledge so they will be better equipped to confront the emotional traps of investing when prices move dramatically. Thanks again. Kind regards, Andy
Hey Andy,
Great article, It was informative, and very detailed. I learned a great deal reading your post. What I didn’t realize was how in depth the whole process was. You must watch the market daily, and keep track of your trends or you could miss a detail that could burn you pretty quickly. Day trading was something that I never understood because I couldn’t grasp the idea of why someone would want to just sit to watch the stock market everyday. After reading your article it now makes more sense what they are really do.
The numbers game is serious business. I will continue to leave it to my broker cause it seems too much for me to keep track of hehe.
Thanks for the great article.
Kevin
Hi Kevin,
I am glad you found the article interesting and I hope useful. I don’t day trade myself and actually one point that is made in part 2 is that the same patterns in price movement are visible over different timescales. I prefer to trade on quarterly and much longer cycles paying attention to which sectors and industries are outperforming the others. You are right, numbers are a serious business. I think we are still in for some rocky times because we have not seen the end of the impact on the world economy of the coronavirus, not by a long shot. One could even cynically say that the main reason that stocks are still at high prices today is that all that money sloshing around in institutions and pensions funds doesn’t have anywhere else profitable to go. I think it is just a question of when the confidence cracks and everyone bolts for the exit again.
On that happy note 🙂 I wish you a great day!
Kind regards
Andy
Awesome buddy and hello! This is the best thing I have ever heard about stocks. You have powerful tools for doing technical analysis on stocks. You talk about many interesting resources and models to analyse stock prices. I will read more and try to learn more on investment and stocks in particular to get myself in the loop. I must say you did a great job writing such an informative article I enjoyed reading it and I did learn a lot from it, thank you very much for sharing.
Juma
Hi Juma, thank you for the positive feedback. Technical analysis is just one way of looking at price movements of financial instruments and in particular stocks. If you are interested in stock valuation and price movement do check out the links in the article to the other main areas of financial analysis. Thanks again and best regards, Andy
Despite English is not my native language, but this the only article I’ve came across which describes fully and easy what is the technical analisys itself! Thank you very much, Andy for your labor. Wikipedia must hire you to issue the explanation articles.
Best Regards,
Mikhail
Hi Mikhail
Thank you for your positive feedback. I am pleased you found the article useful.
Kind regards
Andy