What is the quality investing strategy? On the surface, the answer is quite simple. It just means that you build a portfolio composed of high-quality assets. Quality is also an investing factor as this article explains.
In the case of fixed-interest assets, high-quality will mean low-risk US treasury bonds and other triple-A graded corporate bonds for example. It would not mean lower grade, higher-risk junk bonds, distressed sovereign debt, or higher-risk municipal bonds. Though these assets may have a higher chance of greater returns, they would not qualify as quality fixed-interest assets.
As regards stocks the situation is a little more complex.

On a personal note, investing in quality is what my Grandfather always did and always encouraged his family to do. Actually “encouraged” is the wrong word, it was more of a holy edict, any deviation from which would be viewed as heresy punishable by ridicule, disowning, and then exile. Yes, I exaggerate but I think you get the point.
The quality of a stock
The quality of a stock has some hard and fast quantitative elements to it and some soft, fuzzy, and looser elements. I guess the soft elements would also be referred to as qualitative but since we need to consider broader aspects of quality, let’s avoid that semantic rabbit hole.
Financial quality
The financial quality or soundness of a company will be evident from its balance sheet and profit and loss accounts and any other financial statements available including statements of sources and application of funds.
On the balance sheet, we will want to see healthy solvency ratios, measuring the debt of the company against shareholder equity and assets. This tells us how readily the company could cover its debt and tells us how risky the company is.
We would also want to examine the liquidity ratios of the company, so the ratio of short-term assets to short-term liabilities, otherwise known as the current ratio, and cash to short-term liabilities otherwise known as the acid test. The difference between short-term assets and cash is that short-term assets will also include inventories, works in progress, and the like which on the downside may actually be nearly worthless if the company ceases operations for whatever reason.
Valuation ratios will tell us how the market values a company with respect to its operations and assets. So here we are looking at market price to earnings or sales and also in relation to the book value of the company.
Many analysts prefer to dig deeper because reported earnings can be subject to revenues from one-off transactions and accounting changes. So many prefer an indicator that measures how the total assets deployed by the company result in operational profits. The measure used by most analysts today is:
Enterprise value / Earnings before Interest, tax, depreciation, and amortization or EV/EBITDA for short.
Here is another article that explains the above financial ratios.
The quest for quality stocks
For our purposes of sorting out quality stocks, we will also consider activity ratios relating to operations. These ratios tell us in days how rapidly a company turns over its assets, inventories or receivables. We will also look at one price-related ratio and that is the dividend payout ratio.
While valuation ratios are very relevant to the market price of a stock, from a purist quality perspective they are less important. We are defining quality here to mean the intrinsic quality of the company from a financial, management, operational, branding and competitive perspective. We are less concerned with how the market may view the stock and determine its price.
The ratios across industries
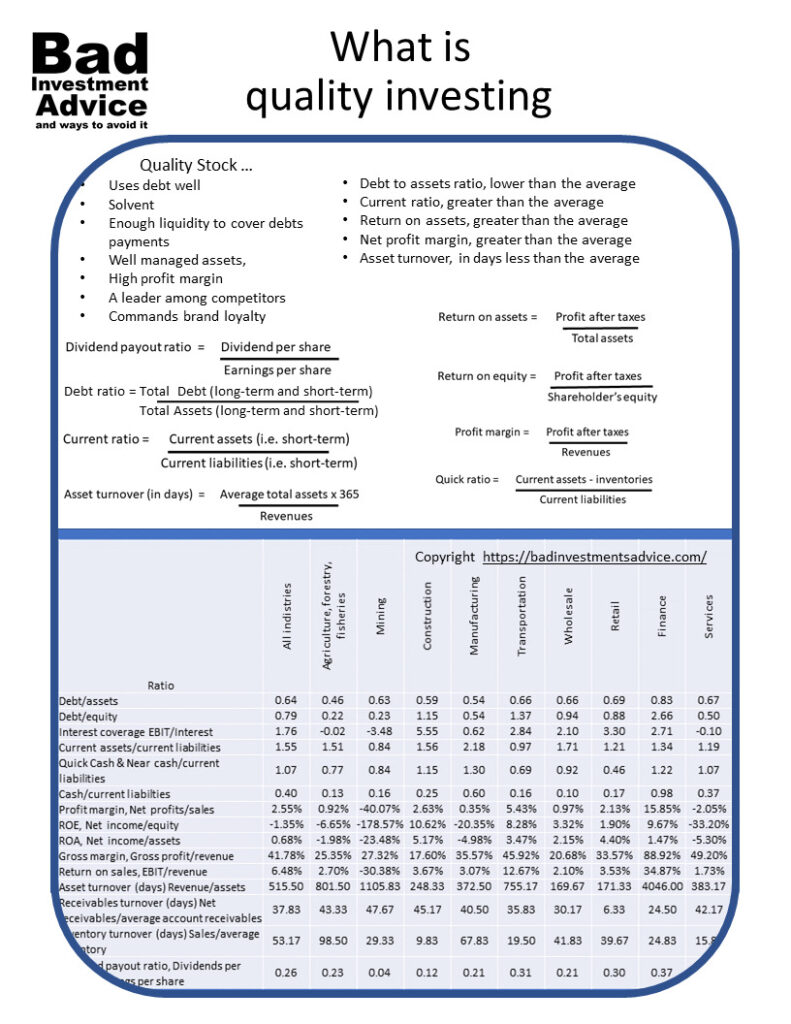
So much for the dry theory, what do some of the major ratios in these different categories across major industry groups look like. The table here considers the main solvency, liquidity, profitability, operating or activity, and one price ratio across major industry groups. These are all average figures for the last six complete calendar years, i.e. 2014 to 2019.

Data source: Readyratios.com1)Data source: Readyratios.com All average figures shown are the mean of the median figures for each complete calendar year 2014 to 2019. All calculations and tables by badinvestmentsadvice.com
This can look like a bewildering array of figures so we have to dig a little deeper to understand what is going on and then be able to assess what higher-quality stocks would look like.
Quality as regards solvency
Let’s take a closer look at the main solvency ratios. They are:
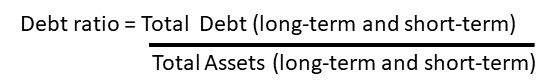
- debt to assets ratio
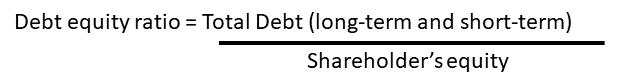
- debt to equity ratio, and
- interest coverage
If you don’t work with financial reports on a routine basis, it is easy to forget some simple relationships. In this area let’s just remind ourselves that on a balance sheet

and

Remembering these simple facts we see that the first two ratios are closely related.
The debt to assets ratio tells us how much debt a company has taken on in relation to its total assets. The higher the number, the riskier is the operation. A low debt to assets ratio would tend to indicate a safer and more conservative approach to financing company operations.
The debt to equity ratio is similar except that it measures whether a company’s assets are financed more by debt than by equity. The debt to equity ratio is also a measure of the riskiness of the company and it’s another way of looking at how much debt the company has taken on.
The debt to equity ratio is of direct concern to shareholders. If investors are holding shares for the dividends and if circumstances change they can find themselves in competition with debt since the company will be obliged to pay the interest on its debt before it can payout dividends to shareholders.
The other important ratio in this group is interest coverage which is earnings before interest and tax in proportion to the interest charges.
Solvency ratios in different industry groups
Just looking at the solvency ratios across our different industry groups this is what we see.

Firstly the debt to assets ratio across most industries is around 0.6 to 0.7 with just a couple of outlying exceptions. The agriculture, forestry, and fisheries group have a low figure while the finance group has a high figure.
However, when we dig deeper into these groups we find significant variations across industries within this group of typical debt to assets ratios.
Just taking the agriculture forestry and fisheries group, at one end of the scale, forestry companies carry almost no debt with average ratios as low as 0.02 but agricultural services companies have average ratios between 0.6 and 0.7.
We see the same situation if we look into the other ratios of industries within the broad sectors.
How we are measuring the quality of a stock
Our approach to determining quality is to look at the ratios in comparable industries, to see where the average values are and then determine where the higher-quality companies would be in relation to those average values.
What this tells us is that we cannot look at these financial ratios in any meaningful way across sectors because the industries within the sectors are too dissimilar for the purposes of comparison. We have to go down to the individual industry level to be able to benchmark and determine what quality ratios look like.
Solvency ratios across industries
OK, so this is what our solvency ratios look like across all industries sorted according to the Standard Industrial Classification (SIC) system. Column # COs shows the number of companies in that category. There are so many industry groups here I’ve had to break the table into two halves.

And here’s the second half

There were a number of industries I removed after seeing they were unlikely to be candidates for quality stocks. These included:
- Agriculture production, livestock
- Forestry
- Fishing hunting and trapping
- Leather and leather products
- Personal services
- Misc repair services
- Legal services
- Social services
Either because the number of companies in each of these industries was too low for benchmarking purposes or because as a group they were unprofitable or otherwise financially distressed during the six-year period and so would not be candidates for quality stocks.
You could also argue that some obvious industries are missing. Where is software, internet, and where is bio-tech for example? Well under this classification system software and internet companies are under Business Services and biotech and pharmaceutical companies are under Chemicals and allied products.
Confusing, I know but we have to work with what we have. The other thing to remember is that following our definition of a quality stock, they are unlikely to be found in new and rapid growth industries.
Solvency ratios and quality
Starting again with the debt to assets ratio, we would expect that a quality stock has a debt to assets ratio that is average or less than average for its industry. We would not expect that the debt to assets ratio is dramatically lower than its industry average. That would indicate inadequate use of financial opportunities and thus poor financial management.
For debt to equity again we would expect a quality stock to be at or below the industry average.

For the interest coverage ratio, not only would a quality stock have an above-average ratio, but anything below about 1.5 indicates a company could be vulnerable to interest rate rises.
With the above criteria in mind, just scanning down the list there would be industries where I would not look for quality stocks. I would certainly eliminate any industry with negative interest coverage.
Liquidity ratios across industries
Here are the two tables of liquidity ratios.

and here is the second table.

Looking first at the current ratio, which is current assets / current liabilities.

Current assets are all those assets that were turned into cash over a financial year and current liabilities are all those liabilities that need to be paid over the same period. Looking down the tables we can see that the current ratio hovers between about 1 and 2.
That is what we would expect.
As an example, banks look at the current ratio to see whether to make loans. We would generally want to see a current ratio of more than 1.5 but greater than 2 suggests the company is not making optimal use of its assets.
Then we have the quick ratio.

The quick assets are all cash and assets that can be turned into cash quickly. A quick ratio of less than 1 is bad but again you would want to see a quick ratio that is greater than the average for the industry.
The cash ratio is

Analysts tend to pay less attention to the cash ratio. Again we see that the average varies across industries and generally we would want to see a cash ratio of more than 0.2. But if the cash ratio is too high that is an indication of poor financial management.
Profitability ratios
Here are the main ratios that express the profitability of a company

and here is the second table

As can be seen, we have quite a few measures of profitability, the first one being the profit margin:

The profit margin is about the most basic measure of profitability. A profit margin of 10% is good, 20% is much better and 5% or lower is bad, but as before we should compare within the same industry.

Return on equity or ROE is probably for shareholders the most important ratio. An ROE of more than 10% is considered to be good. However, ROE is greatly affected by general economic conditions so again we have to compare ROE with other companies in the industry.
A very high ROE can be a sign of dangerously high leverage. So all of these ratios have to be considered as a whole.

Return on assets or ROA varies widely between industries. It is one of the most important ratios for determining the quality of a company as it measures its ability to turn all the assets it controls, into profit.
ROA can also show how capital intensive a company is. Analysts will want to see ROA that is significantly greater than the cost of capital for a given company.

Gross margin is the most basic ratio that measures the profitability of the normal operations of a company. It is an efficiency measure or how well a company controls costs. To look for quality stocks we would look in industries that have higher than average gross margins across all sectors, so above 40%, and then individual companies with gross margins higher than their industry average.

The operating margin is also similar to the gross margin but only factors variable operating costs. It is often also called the Return on Sales or ROS for short. Operating margins vary significantly from one industry to another and should only be used to compare very similar companies or to assess a company’s performance from one year to another. Generally, an operating margin that is higher than the average for that industry is good.
Activity ratios
Activity ratios give other insights into a company’s operations. Here are the average activity ratios across all industries.

And here is the second table

Each of the activity ratios looks at the turnover, abbreviated to TO, in terms of days.

Asset turnover varies greatly from one industry to another depending on whether it is capital or labor-intensive It is also noticeable that industries that operate on low profit margins, like discount retail outlets, will tend to turn over their assets more rapidly than other industries that operate on higher profit margins like many service industries. A general indicator of quality would be if a company’s assets are turned over more rapidly than peers in its industry.

This is a measure of how rapidly a company collects debt on credit purchases. Again there will be large differences between industries but generally, we would want to see a figure that is either average for the industry, or lower.
If receivables turnover is higher than average for the company’s industry then that shows it is having trouble collecting payment from credit clients. That could mean it has been doing business with less credit-worthy clients or its accounts receivable department are asleep at the wheel.
On the other side of the coin, if a company’s receivables turnover is significantly lower than average for the industry that could mean its tight credit terms are turning away otherwise viable clients.

This is a measure of how efficiently a company is selling its inventory to turn into profit. It is a measure that is very industry-specific. If a company’s inventory turnover is higher than the average for its industry then that can be a sign of poor inventory management. It can mean the company is carrying obsolete stock.
As if often the case there is also a danger if the inventory turnover is significantly lower i.e. shorter in days than its industry average. That can mean there are frequent shortages and it is frustrating its clients which is also bad for business and not what we would want to see in a quality stock.
Price ratios
There is just one price-related ratio we will look at that is relevant to our definition of quality and that is the dividend payout ratio.

and here’s the second table


As the term suggests, this is the proportion of a company’s earnings that is paid out in dividends to shareholders. Earnings that are not paid out in dividends are reinvested in growth. Mature companies tend to have high dividend payout ratios while young companies tend to retain earnings to grow the business so will have low or zero dividend payout ratios.
Investors like to see steadily increasing dividends, but companies with very high dividend payout ratios can be at risk of having to reach into reserves or worse borrow to maintain a high payout ratio if earnings drop and they don’t want to upset investors by lowering dividends.
We can also see there are some data anomalies in our tables. Agricultural services and Lumber products look as if they are paying out in dividends vastly more than they are earning. That is obviously just plain wrong data and we should ignore those industries in our tables.
Are all these numbers really necessary?
I’d say that depends.
Let’s say you are looking to compose a small stock portfolio of say 10 stocks, and you want to have only quality stocks in your portfolio. Also that you intend to hold these stocks for as long as they maintain your quality criteria. Then I would say to do your due diligence, you do need to dig into all of these, at least for the final candidates on your shortlist.
However, to arrive at your shortlist you can start by examining just some of the main ratios, in that case here would be the ones to use:
- Debt to assets ratio
- Current ratio
- Return on assets
- Profit margin (net)
- Asset turnover
We would still adopt the same approach to generating a shortlist. We would compare each of these against the average for that specific industry. In each case we would look for:
- Debt to assets ratio, lower than the average
- Current ratio, greater than the average
- Return on assets, greater than the average
- Net profit margin, greater than the average
- Asset turnover, in days less than the average
In essence, these ratios should tell us whether the company uses debt well and is, therefore, solvent, has sufficient liquidity to cover its debts, is managing its resources to generate returns, is profitable and efficiently managed.
Assessing management quality
Not to be confused with quality management, which is a whole other discipline in its own right, here we are considering what financial analysts look for when they are trying to determine the quality of the management of a company and other less quantifiable attributes such as branding, community and labor relations and general standing in its industry.
The traditional way was to go and visit them. Ask for a tour of their plant. See whether the workers are happy and well-treated. Contact suppliers and see how they are treated by the company. Assess the company’s competitive position. Look for brand loyalty among its clients. Look for the history of how they deal with customer complaints. Check in the local community where they are based how the company is viewed.
As a retail investor, you are unlikely to have the time to spend doing all that but there is much that can be learned online. Here are just some obvious ideas.
- Check Better Business Bureau for customer complaints
- Google, Bing, and Yahoo search and look through – supplier complaints, customer complaints, worker complaints, community complaints
- Read the last 5 company reports management statements – look for consistencies and inconsistencies – did they do what they promised.
- How much of the company stock do the company directors own?
- Research articles that discuss its competitive position and brand loyalty
Many professional analysis companies develop scorecards to assess these softer aspects of the quality of a company. Some of these companies list their ratings online.
Using published quality ratings
Another approach is of course to let professionals do all the above for you and just compare the quality listings published online.
Some options are Value Line safety, Value Line finance, Morningstar moat rating, Standard and Poor’s credit rating. This is an easier approach but it may not fully satisfy the do-it-yourselfers.
Alternatively, you can do the analysis and shortlisting yourself first, and then when you have your finalists, check what professional analysis have to say about the quality of the companies to make your final selection.
Or quality factor funds
Yet another even simpler approach to building a portfolio of quality stocks is to buy one or more quality factor funds. But then, where’s the fun in that?
This article gives more history on the subject of quality investing.
Questions and Answers
Q. What are the important ratios used to assess quality of a stock?
A. The main ratios used to assess the quality of a stock are: debt/assets, current ratio, return on assets, net profit margin and asset turnover.
Q. What are quality stocks and what does that mean for investors?
A. Quality stocks have stronger balance sheets, higher profitability are more financially stable and better managed that other companies. For investors, higher-quality stocks tend to outperform lower-quality stocks over the long-term.
Q. Which famous successful investors used a quality strategy?
A. There are elements of Benjamin Graham’s approach which involve identifying quality stocks, though Graham is more associated with value investing. Warren Buffet is the most famous and successful proponent of investing in quality stocks for the long-term.
Single-page summary
Here is a single-page summary of the quality investing strategy available as a PDF download.
I hope you found this article interesting and useful. Do leave me a comment, a question, an opinion, or a suggestion and I will reply soonest. And if you are inclined to do me a favor, scroll down a bit and click on one of the social media buttons, and share it with your friends. They may just thank you for it.
Disclaimer: I am not a financial professional. All the information on this website and in this article is for information purposes only and should not be taken as investment advice, good or bad.
Affiliate Disclosure: This article contains affiliate links. If you click on a link and buy something, I may receive a commission. You will pay no more so please go ahead and feel free to make a purchase. Thank you
References
| ↑1 | Data source: Readyratios.com All average figures shown are the mean of the median figures for each complete calendar year 2014 to 2019. All calculations and tables by badinvestmentsadvice.com |
|---|
Just pure gold in this article. I really like how you explained pretty much everything that a person needs to know if they plan to invest into stocks. I myself plan to put some money in couple of great stock so this article was a great eye opening for me and it helped me a lot. Thank you.
Hi and thank you for your positive comment. I am glad that you found the article useful.
This was very interesting. How and where could I find out about the current debt ratio of a company? Are there any good sites that show those numbers? What is your advice for someone who would like to invest in quality stocks but has no or little experience with it?
You should be able to look up the debt ratio of a listed company on your broker’s platform. I use E*Trade and when I look up any company by the symbol, I can find all the main financial ratios under the tab Fundamentals. E*Trade also allows me to screen stocks by debt ratio. As for free online resources, Yahoo Finance has excellent stock screeners that also allow you to screen stocks with set debt ratios, i.e. either greater than, less than, or equal to set values, and by many other fundamental ratios. Strangely I am not able to find the debt ratio of individual companies on Yahoo finance. But if you want to know the debt ratio of any company, look up the last annual report and then look for the balance sheet. Look for Total Liabilities excluding shareholder equity, divide that by the Total Assets and that is the debt ratio. There are two easy ways to invest in quality stocks. Firstly you can buy ETFs that have strong or exclusive quality factors. Many of the major fund providers have ETFs with quality factors. The second approach is to look for stocks that have high analyst quality ratings. The Morningstar Moat rating is a good and simple one to use. It follows a definition of quality that Warren Buffet was fond of. He likened quality companies to impregnable castles surrounded by a moat. The wider the moat the less assailable the castle is to invading marauders, in other words, the competition. I hope this helps.
Best regards, Andy
Smashing content you’ve compiled here Andy, especially the solvency ratios which is my weakness but somehow I managed to grasp a little bit on the whats and hows. For the interest coverage ratio, I just need to make sure to only choose companies that have a higher than 1.5 quality stock to minimize interest rate rise, right?
Hi Riaz and thanks for your comments. To your question on dividend coverage ratio, yes, if you are buying into stocks that pay dividends any that have a dividend coverage ratio of less than 1.5 are at risk of having difficulty maintaining dividend payments when interest rates rise. The market tends to knock down share prices when dividends are cut so those kinds of situations are best avoided. Of course, having said that in the current environment, the US Federal Reserve banks have published their expectations of where interest rates will be through 2022 and most of them expect them to stay at the current low levels. Best regards, Andy
If I could explain to you how confused I feel at the moment, you would freak out. It’s more than obvious that you’re a well-rounded trader, and I would love nothing more than to reach the level that you’re at now.
As for now, I can only hope for the better, and with being said, I’ll make sure to go through your quality investing strategy once more in hopes that this time something will click inside my head.
Thanks for sharing your knowledge unselfishly and know that I wish you many successes in the upcoming year.
Gorjan
Hi Gorjan and thanks for the positive, or at least I hope positive comments. Sorry for the confusion. I did get a bit lost down the rabbit hole of trying to explain quality in relation to stocks. I guess I wanted to go back to basics and build from there. The simplest way to understand quality stocks is probably to read the assessment of analysts and look for explanations of why they give specific stocks high-quality ratings. They will often go into explanations of how the company compares with its competitors in terms of its balance sheet, income, and competitive position. By the way, I am not at all convinced that investing in quality stocks is the best strategy, it is certainly not a good way to approach trading and I would only find myself entering positions on what might be quality stocks if the technicals indicated this was a good thing to do at that time. I think perhaps the point of this article is that the quality of a stock or any financial investment is a measure of resilience. Many conservative investors feel more comfortable if their portfolios have a high proportion of quality stocks.
Going off on a tangent here, your comment reminded me of a conversation I had with my high school physics teacher. I thought he was a very clever bloke until one day he admitted to me that he was only two pages ahead of the whole class in the textbook, his subject was chemistry. It just goes to show.
Again I am sorry for the confusion and I hope this response helps. I will try and keep my articles less complex and turgid, going forward.
Best regards
Andy
This Was A very detailed informational post with a lot of insight! Before I read this I knew nothing about any of it. I love to learn about new things every day. You can never truly have enough knowledge! I cant wait to see what else I can learn from your website. I will be visiting now way more often. Thank you for all that I learned from this post,
Your Friend, Johnny
Hi Johnny and thanks for the very positive feedback. I am glad you enjoyed it and I hope you come back often. Best regards, Andy
Ohh, aren’t you lucky, having a grandfather that invested as well. Virtually nobody in my family invested. And when my parents by accident got into investing a big sum of money (they thought they were putting it in a savings account) I had to explain to them what they had unknowingly done.
But I am not the best of investors myself either. I tend to look more at whether the industry appeals to me than at the rational data. So I learn a lot every time I read one of your articles.
I will try to put your tips into practice next week when I am going to do my half-yearly review of my portfolio. 🙂
Hi Hannie and thanks for the comment. Even though my grandfather was a great example his style of investing was more like saving. He had a paranoid horror of the stock market and only invested in bonds and savings certificates. His timing wasn’t great though and much of the interest he gained was eaten away by inflation. I think the danger of investing in industries that you like is that the interesting sexy ones aren’t always the best performing ones.
This article makes that point by looking at industry sector relative performance
btw I should add with regards to this article – I am far from convinced that investing exclusively in quality stocks would be good in my situation. Without being morose, I’m not sure I would live long enough to reap the fruits! Good luck with your portfolio review and may the chips fall in your favor! Best regards, Andy
You have great knowledge of the financial markets Andy. This is indeed a wonderful article. I will try and follow your advice as much as I can. I am definitely going to read more about what analysts say.
Regards,
Aps
Hi Aparna and thanks for the positive feedback. Best regards, Andy
Hi Andy. What an excellent, detailed write-up – it’s nice to see a blogger that will ‘go the extra mile’ these days with so many creating ‘fluff’ of a few hundred words. Thank you.
Although I have one or two single stocks (like Amazon and Google) I typically stick to investing in low-cost funds because I simply don’t have the time to do the research necessary to construct my own stock portfolio.
Out of curiosity, are you following WB’s ‘be greedy when others are fearful’ approach and buying-in during these difficult times?
Hi Richie and thanks for the positive comments. Yes, I try my best to do as the great WB did and be ready to buy when others are fearful. The difficult part is actually having the cash on hand to do that. It is all too easy to be caught fully invested when the market starts to top and turn. If you aren’t quick off the mark then you find yourself sitting on a lot of losing positions. I think long-term the market is strong and will go higher. Though it is showing signs now of being overbought so we could see a pull back soon. But who knows – I would not try to predict.
Btw I think your approach of buying into low-cost funds is an excellent way to go to build a portfolio., Best regards, Andy
Hi Andy. That’s a lot of math and pretty advanced stuff you’ve put together there. Really interesting, but still way over my head. I’m still chewing on the basics 😀 My question is a bit off-topic, I guess, as this article mainly revolves around stocks, but I hope you don’t mind answering it anyways: Cryptos are pretty hyped currently and with bitcoin having just set a new all-time record high, how would you rate investing into crypto currencies in general and individual cryptos in terms of “quality”?
Hi Chris, yes, there are a lot of numbers but actually the math behind it is very basic indeed. You could say that the article is an aggressive distillation of just some of the aspects that fund managers assess when they seek to gauge the quality of stocks. Nevertheless, as you say there is still a lot of detail there but I think we have to remember this field attracts and engages large numbers of very bright people, so it is hardly surprising they try to leave no stone unturned.
I do think that cryptocurrencies and Bitcoin, in particular, will likely rise further than they have already. It is quite clear that many people are buying Bitcoin. I don’t think it could be said though that there is any intrinsic value or quality in Bitcoin, other than its scarcity and, we hope, intrinsic security. It is hard to view it as anything other than a speculative play. However, because of its scarcity and the speculative interest, it has attracted, I agree that it is unlikely we have seen the price peak yet. How long with the party last? that must be anyone’s guess. Best regards, Andy