Anyone setting out on the journey to financial independence through investing is going to have to come to grips with the financial ratios used to compare one company with another. This financial ratios cheat sheet should provide you with a shortcut.
The types of ratios
Financial ratios attempt to provide different insights into the risk, profitability, stability, and competitiveness of a company. There are many financial ratios. Some are of interest to managers seeking to compare their operations with competitors or the industry at large. Other ratios are of interest to the investor. We are going to look at the main ratios of interest to the investor.
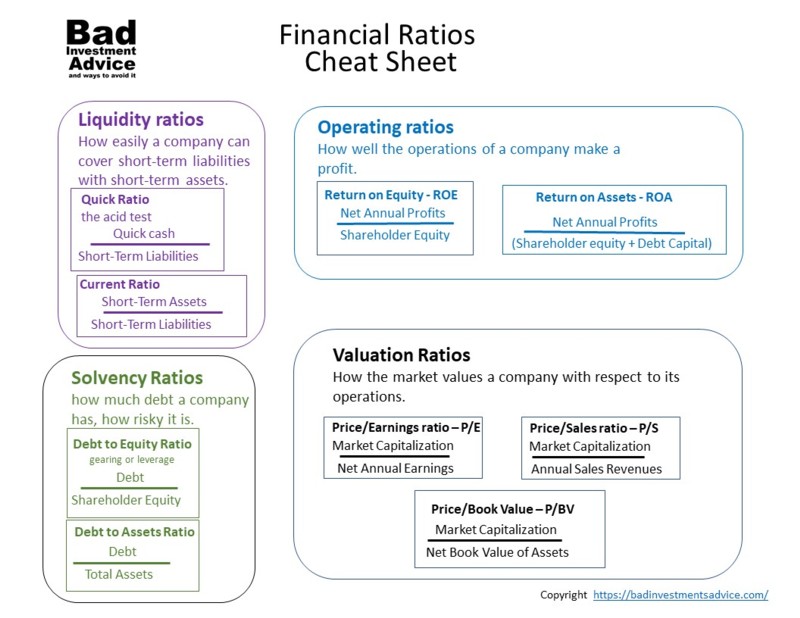
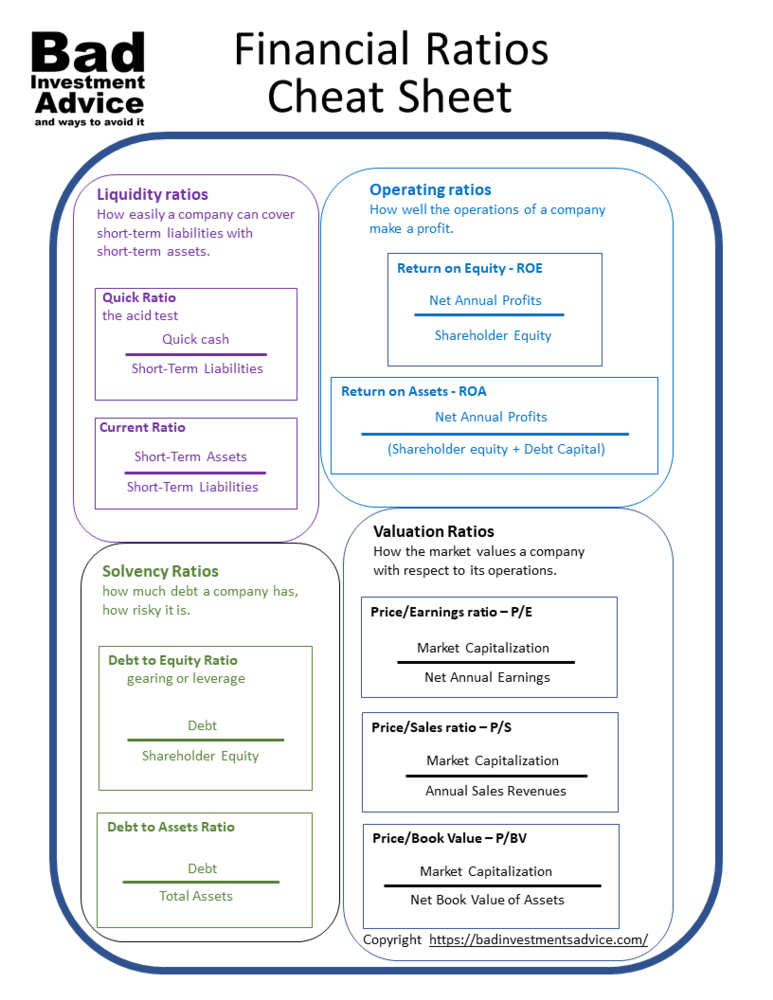
Liquidity ratios – liquidity is a measure of how easily a company can use its short-term assets to cover its short-term liabilities.
Operating ratios – measure how well the operations of a company make a profit.
Solvency ratios – measure the degree of a company’s debt to other aspects of the company such as its assets, equity, or revenues. Solvency ratios give an indication of the riskiness of the company.
Valuation ratios – provide a measure of the current value placed on the company by the market as a function of its share price in relation to other measures of the company such as its earnings, its sales, or asset values.
Other ratios – All the above ratios look internally into a company’s operations and finances and its current share price and therefore market valuation. Other ratios compare a company with the market. Some of the ratios used to assess options that go by letters of the Greek alphabet also apply to stocks.
Beta – is the measure of how a stock price moves relative to a broad market index such as the Standard and Poor’s 500 index.
A beta of 1 means that the stock price tends to move in step with the market if the market goes up 1% then the stock price goes up 1% and if the market goes down by 1% then the stock price goes down by 1%.
A beta of 2 means if the market goes up 1% then the stock price goes up 2% and similarly in a downward direction.
Beta can also be negative. A beta of minus 0.5 means if the market goes up by 1% then the stock price goes down by 0.5% etc.
In practice, Beta only works for small incremental changes in relatively stable markets. A Beta of zero means that the stock price moves independently of the market.
Alpha – is a measure of the return on investment of a stock compared to the market over a period. An Alpha of 2% means that a stock returned 2% more than the market over a given period. As another example, a negative Alpha of 3% means that the stock underperformed the market by 3% over a given period.

Liquidity ratios
There are two ratios that give an indication of the liquidity of a company.
Quick ratio – this is a measure of how quickly a company can pay off its short-term liabilities. Quick assets are assets that can be turned into cash either at or near their book value. A quick ratio of 1 means that a company can raise at short notice just the cash it needs to pay its short-term debts. A quick ratio of 1.2 means that a company can raise 20% more than it would need to pay off its short-term debt. The quick ratio is also often called the acid test.
Current ratio – the current ratio is similar to the quick ratio but includes inventories in the calculation of current assets. It assumes that a company will be able to liquidate all inventories at their book value. If a company is turning over its inventories at a rapid pace this may be a reasonable assumption. But if a company’s inventories are not moving quickly then this may be a less reliable measure of liquidity.
It is quite usual for companies in different industries to have different liquidity ratios. You expect companies that turn over assets rapidly to have good quick and current ratios.
Retail companies should have healthy current ratios as long as they don’t get stuck with obsolete inventories.
Companies in capital-intensive industries with a lot of plant and machinery often have poor current ratios. That isn’t unusual and isn’t necessarily a bad thing. It often means capital-intensive companies use long-term assets to raise short-term funds which is a practice that has risks and downsides.

Operating ratios
Return on Equity – often abbreviated to ROE is similar to a measure used to determine the profitability of a business venture or project – Return on Investment, ROI. The difference between ROE and ROI is that ROE considers the net profits of an operation from the perspective of the equity investor i.e. the shareholders.
In other words, if I’m a shareholder owning shares worth $100, I want to know my share of the net profits from a business operation. If the return on my $100 was $120 then great that is an ROE of 1.2 ROI is a measure of net profits with respect to the total investment which is the shareholder equity and the debt.
Return on Assets – abbreviated to ROA. In effect, ROA is numerically the same as ROI because on a balance sheet the total assets equal the total liabilities. It is just a question of how and where the terms are used.
ROI is used mostly for internal business decisions within a company while ROA considers the total assets and the total return on those assets from the investor’s perspective. ROA is a measure of how well the company is deploying the assets of a company to turn a net profit.
Capital-intensive companies will often have dramatically different ROE vs ROA when they carry large amounts of debt. On the other hand, a service company may not carry much debt and its equity and assets may be numerically very similar.
Others in this stable: Return on Capital Employed. Gross profit margin, operating profit margin, and net profit margin.

Solvency ratios
This is where it is important to understand the fundamental difference between debt and equity. Very simply equity is ownership and debt is borrowed. Debt to equity is also referred to as leverage. Sounds simple but things can get fuzzy in the world of high finance.
The distinction between debt and equity gets very fuzzy when a company is going up against a wall or when it has taken on more debt than it can handle. When things go south creditors, as in owners of debt can find themselves owning some or all of the company.
Important solvency ratios are
Debt to equity ratio – this is a measure that shows the extent to which a company is financed either by debt or by equity. This is also referred to as gearing and leverage.
A highly leveraged company has a high debt to equity ratio, in other words, it is carrying a lot of debt.
Companies with substantial holdings in real estate, plant, machinery, or infrastructure such as utility companies or commercial real estate companies often have higher leverage and debt to equity ratios than other industries.
Debt to assets ratio – this measure shows whether a company has enough assets to meet its debt obligations and whether there would be anything left over to return to shareholders. If a company does not have enough assets to meet its debt obligations then it is insolvent.

Valuation ratios
The valuation ratios are the ones traditionally most talked about in investment circles. Valuation ratios give an indication of how the market values a company with respect to its operations. Here are some of the most common:
Price to earnings – abbreviated to P/E. This is the price put on a company as measured by its market capitalization divided by the reported net earnings before any payment of ordinary dividends.
It gets more complicated when you dig into the details but of all ratios, P/E is often considered to be one that can or at least should be comparable across industries and sectors for mature companies. By mature, I mean that the company is selling its goods and services in more or less stable market circumstances.
A start-up company that is still heavily involved in research and development may have low or no sales and hence no earnings so may have a near-infinite P/E ratio.
The other issue with earnings is that accountants have some flexibility in how they can report earnings.
Accountants know that they will achieve a better story for their company and hence share price if they can report steadily growing earnings over as long a period as possible and then report really bad earnings for just one or two periods before returning to a good story of steadily growing earnings.
For this and other reasons, P/E is often viewed with a little skepticism.
Caveats aside the P/E can also be calculated for entire markets and will give an indication of whether the market is overvalued or undervalued.
Price to Sales – Price to sales is exactly what it says. The market price either as the market capitalization divided by total sales revenues, or the share price divided by the sales revenues per share.
It is generally not as easy to fudge sales revenues as it is earnings in financial statements. However, sales are also a function of asset turnover and vary substantially between industry sectors and industries.
Retail companies can turn over their assets multiple times in an accounting period and hence will have very high annual sales revenues in comparison with capital employed.
Companies in heavy manufactures turnover assets more slowly and will have lower sales revenues compared with capital employed.
Price to book value – This is the market price divided by the book value of the assets of the company. The book value is the value recorded in the books of all assets.
Short-term assets are recorded at cost while long-term assets are shown after depreciation. A low price to book ratio was traditionally of interest to investors looking to take over a company and then break it up selling off the assets.
Enterprise Value / Earnings Before Interest Tax Depreciation and Amortization.- abbreviated to EV/EBITDA. It’s a bit of a mouthful.
If you look through finance books and articles from before the days of automated and computerized trading they only talk about P/E, P/S, and P/BV. But since those more innocent times, investors have wised up to accounting treatments and are forever on a search for more objective assessments of how companies are actually doing.
Without investigating all the ins and outs, EV, Enterprise Value is shareholder equity plus debt capital and the ratio EV/EBITDA is a measure of the overall profitability of the company.
Using Financial Ratios
Financial ratios are most revealing in two ways.
- When you compare the same ratios for similar companies in the same industry. This will tell you how well a company is doing compared with its competitors.
- Comparing the ratios for a company with its ratios from last year tells you whether the company’s situation is improving or not.
This article gives more details on financial ratios.
Affiliate Disclosure: This article contains affiliate links. If you click on a link and buy something, I may receive a commission. You will pay no more so please go ahead and feel free to make a purchase. Thank you!
Getting your finances and your investments in order is important. Many would say it is more important to invest in your own financial education. This could be a good time to check out the American Association of Individual Investors, the AAII.
When you join the AAII, you get access to reports, courses on investing, risk management, asset allocation, retirement planning, managing retirement finances, and other resources, all for a single annual membership fee.
Financial Ratios Cheat Sheet Summary
Here is a summary of financial ratios cheat sheet as a PDF for download.
I hope you found this article interesting and useful. Do leave me a comment, a question, an opinion, or a suggestion and I will reply soonest. And if you are inclined to do me a favor, scroll down a bit and click on one of the social media buttons, and share it with your friends. They may just thank you for it.
You can also subscribe to email notifications. We will send you a short email when a new post is published.
Disclaimer: I am not a financial professional. All the information on this website and in this article is for information purposes only and should not be taken as personalized investment advice, good or bad. You should check with your financial advisor before making any investment decisions to ensure they are suitable for you.
Affiliate Disclosure: This article contains affiliate links. If you click on a link and buy something, I may receive a commission. You will pay no more so please go ahead and feel free to make a purchase. Thank you!
Hi Andy,
Very informative post on ratios, I like the graphic image you provided at the end of the post. Just had one query: I recently came across PEG which adjusts the traditional P/E ratio by taking into account the growth rate in earnings per share that are expected in the future – What’s your take on the same? Is this a important ratio ?
Hi and thanks for this important question. PEG is an important ratio but there are always going to be caveats. You are either looking backwards at previous growth to determine whether the current valuation under represents or over represents that growth, or the PEG factors projected growth in which case it is only going to be as good as the projection. One thing to always bear in mind is that CFOs are always going to want to manage closely how they report earnings in order to influence the stock market valuation one way or another. The accounting standards applied will determine the degree of freedom CFOs have at their disposition. The quest for the investor is to find value, PEG can be a good way to look at that but it is only ever going to be as good as the projection. This is an excellent question and thanks again. Best regards, Andy
I really liked the information you put out on the website and the pictures you used. Really a good website.
Thank you for your positive feedback. Please look around at other posts and come back and check again. Let me know if there is any specific topic in this area that is of interest to you. Best regards, Andy
Hi Andy, This is great! I’ve just saved that cheat sheet to my phone when I’m looking at stocks in this morning. I was just wondering which ones you find the most useful? Of course, when you’re comparing companies against each other – it’s good to know which one is performing better where but what do you look at first? And is there certain ratios that if they’re at a certain level, it says “invest” or “short” or “avoid”? Like for me, I find that if I go into a company’s details and their ROA, ROE, free cash and leveraged cash are all negative, I’m more likely to short
Hi Martina, Thanks for your comment. I actually look for three things. I look firstly that the market cap is at least 150M that gives some assurance that there is an active market and I will be able to sell when I need to. I then look for an indication that the stock is under-valued. That is a combination of P/S, P/E and to a lesser extent P/BV. I then look for upward price momentum. This will be upward momentum over the last 12 months, 6 months 3 months and 1 month – the general trend of the market will influence how many of those indicators I will look for. I would like to replace the P/S, P/E and P/BV for EV/EBITDA but I have to find a way to make that work with the screener I am using. I tend to invest rather than short. Do you prefer to short rather than go long? Best regards, Andy
Great article good use of words and the way it is written in general it kept me interested throughout and wanting to read more!
Very good, 🙂
Thanks for the positive feedback Jason. Let me know if there is any related topic that you would like me to address. Thanks and best regards, Andy
Hi Andy, to answer your question, yes the images were helpful. I also like how you incorporate the term definition into hyperlinks like you do. I was even able to learn a couple new terms from this so for that I am grateful. Great information! Thank you.
Hi Teresa, thanks for the comment. I am glad you found the article interesting and especially the visuals. Best regards, Andy
First impression of your website – very visual and appealing.
I enjoyed reading your article on financial ratio cheat sheet. It was very easy to follow. I wouldn’t say adding more graphics would help any further. Its perfect as it is.
Thank you for this useful information.
All the very best
Hi and thanks for stopping by and leaving your comment. I am glad that you found it interesting and useful and thank you for the reinforcing feedback. Best regards, Andy