 In the world of stocks, a ‘trend’ isn’t just a buzzword thrown around by analysts. It’s a general direction in which the market or the price of a particular asset is moving. Simply put, trends are your best friend when it comes to navigating the volatile waters of the stock market. Recognizing these patterns can mean the difference between strategic investment and a series of poorly timed losses.
Historically, market trends have shaped the financial landscape for decades. Peaks and troughs have been documented from the roaring twenties through the Great Depression to the recent digital age. Each era brought unique patterns that reflect the broader socio-economic panorama. This historical perspective is key to anticipating where current trends might lead you next.
Spotting trends isn’t just vital for long-term investors; even a day trader needs to catch these signals to ride the wave to profit. Trends reflect the underlying strength or weakness of the market, which is crucial whether you’re in for the long haul or making a quick gain.
Technology has revolutionized how we observe market trends. The introduction of data analytics and artificial intelligence has enabled investors to spot patterns with greater precision than ever before. These tools sift through massive datasets to forecast potential market movements, providing an edge in a highly competitive field.
In essence, understanding and identifying market trends is like having a compass in a dense forest. It doesn’t guarantee you’ll find your way out, but it sure increases your chances of getting somewhere profitable. As you learn to read these trends and integrate this knowledge into your trading strategy, you equip yourself with the power to make informed decisions. It’s about combining historical insight with cutting-edge technology to understand where the market’s headed and how you can best position yourself to benefit from it.
Identifying Patterns: Tools and Techniques
Technical analysis is your go-to approach for spotting market patterns. It’s all about looking at past price movements and volume to predict future behavior. Indicators like moving averages, Bollinger Bands, RSI, and MACD are key players in this game. They help highlight trends and potential reversals, making them invaluable for any serious trader.
Tools are handy, but knowing which ones to use and how to interpret the data they show is crucial. Moving averages, for instance, help smooth out price data to identify trends over a specific period, while the Relative Strength Index (RSI) measures the speed and change of price movements. There’s also the MACD – it offers signals for potential entry and exit points.
Examples of Market Price Trends
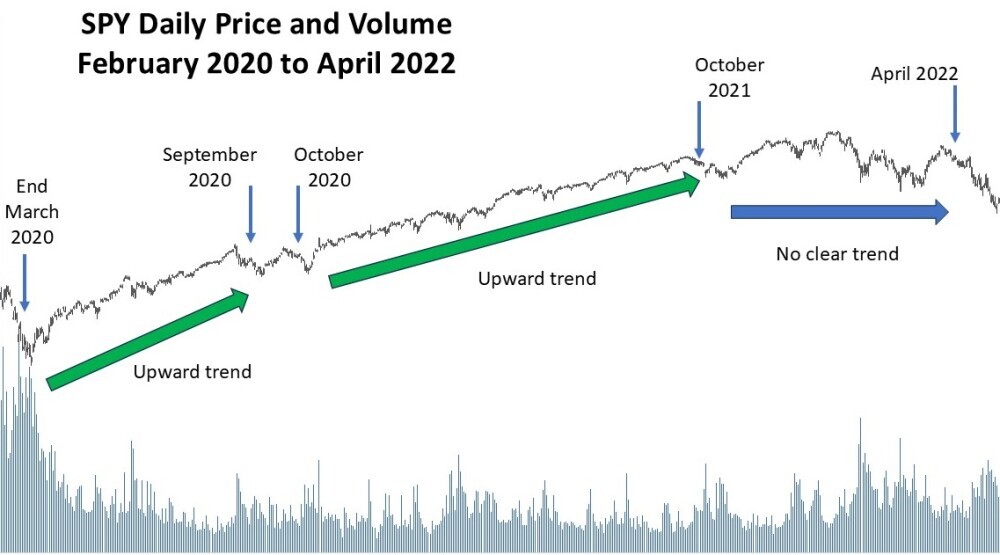
Let’s take a look at a price chart to see what trends actually look like. Here is a familiar chart of the Exchange Traded Fund (ETF) SPY that tracks the Standard and Poor’s 500 Index.
 Source: Yahoo Finance and Bad Investment Advice
We start at the end of February 2020 when the market was experiencing a tumultuous tumble when the COVID-19 pandemic was taking hold. But the rapid decline soon reaches a low point in late March 2020 before bouncing back to a positive trend,
That steady upward trend continues undisturbed until a few weeks in September 2020 when it suffers a minor setback. It seems to stall again for a few weeks in October 2020. The upward trend continues unabated for a full year to October 2021. The period from October 2021 to April 2022 no clear upward or downward trend emerges.
 Source: Yahoo Finance and Bad Investment Advice
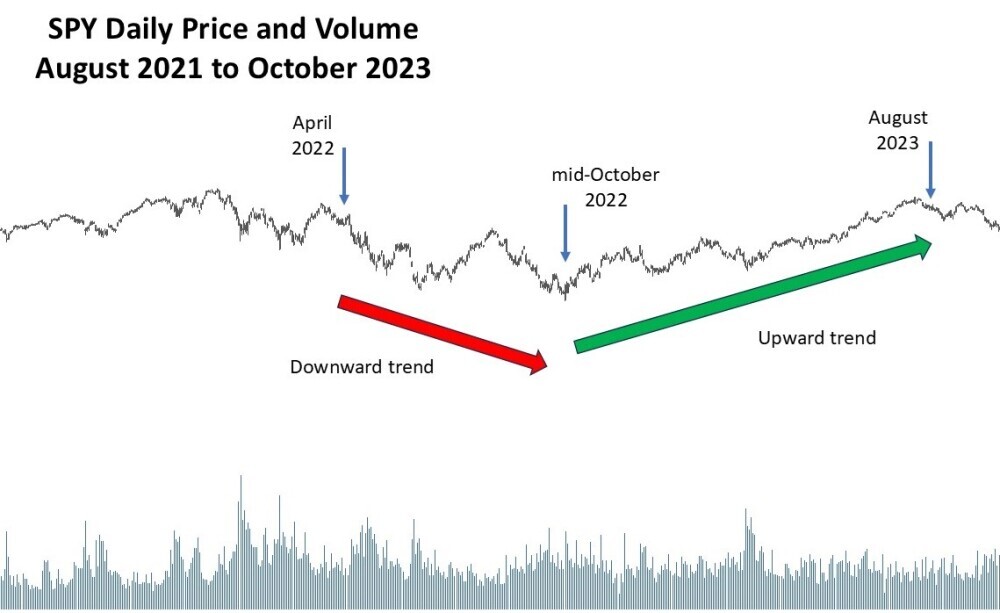
After April 2022 the market is mostly in a downtrend until mid-October 2022. Within that time frame there are short periods of upward movement. But the thing to notice is that this period shows a succession of lower high price points and lower low price points. That implies that overall the price was in a downtrend. Then in mid-October 2022 the market moves mostly upwards, tracing a period of higher high price points and higher low price points until around August 2023.
 With advances in AI and machine learning, pattern recognition has scaled new heights. AI can analyze vast amounts of data at lightning speed, identifying trends that human eyes might miss. Machine learning algorithms can also adapt over time, refining their predictive accuracy the more they learn. It’s this tech that arms investors with insights that were unimaginable just a few years ago.
Despite its strengths, technical analysis isn’t foolproof. Balancing it with qualitative analysis is key. It means understanding market sentiment, the health of the economy, and even the political climate. Numbers tell a story, but they don’t reveal everything. A holistic view ensures that you’re not blindsided by unforeseen external factors.
Pay attention to volume when analyzing trend patterns. An increase in volume can confirm something significant is happening with a stock, strengthening the reliability of your trend analysis. This helps you separate genuine signals from mere noise, helping make smarter trading decisions.
Psychological Factors Influencing Market Patterns
Understanding market behavior goes beyond crunching numbers. The human element plays a huge role in how patterns materialize. Behavioral finance dives into this aspect, studying how psychological influences and group dynamics affect investors and the market at large.
Market sentiment is the collective mood of investors at any given time, influencing stock prices more than you’d think. When the market feels optimistic, stock prices often climb. But when anxiety takes over, the opposite happens. Considering sentiment analysis can add an extra layer of insight to your strategy.
There are plenty of cases where global events have led to dramatic shifts in market patterns. Take, for instance, major political upheavals or economic crises. These events can create panic or optimism, causing stocks to move sharply. It’s about being prepared and understanding that these occurrences can significantly impact trends.
The impact of emotions like fear and greed is often underestimated. When investors act on emotions rather than logic, it creates volatility. Recognizing these emotional cues can help you anticipate sudden shifts in patterns, offering you a chance to adapt before the rest do.
Learning from past events where psychology influenced markets can guide future decisions. Panic selling during a market crash or the irrational exuberance during a bull run—these are scenarios worth studying for their ripple effects on market patterns.
Strategizing for Success: Making Informed Decisions
Crafting a robust investment strategy goes hand in hand with understanding market trends. A well-planned portfolio isn’t static; it evolves with the market’s rhythm, adapting strategies to align with emerging trends. This adaptability is crucial for staying ahead and capitalizing on potential opportunities.
Risk management acts as the backbone of any successful trading plan. It’s not just about maximizing gains but also about safeguarding against potential losses. Employing techniques like stop-loss orders, diversifying investments, and setting clear entry and exit points can help manage risks effectively and keep your investment on track.
Being vigilant about market signals is the key to making informed decisions. Constantly monitor the indicators—technical, psychological, or global events—that could influence market behavior. Being aware of when to buy, hold, or sell can significantly impact your overall portfolio’s health.
Looking at successful investors can provide invaluable lessons. The methods employed by Warren Buffet or Peter Lynch are worth studying. These investors often focused on understanding business fundamentals, market trends, and possessed the conviction to stick with their strategies despite market fluctuations. Their success stories underline the importance of having a solid strategy amplified by the insights gained from studying market trends.
Ultimately, it’s about using every tool and insight available to make strategic decisions that resonate with your personal investment goals. Whether it’s through leveraging technology, understanding psychological factors, or learning from past market movements, the path to efficient stock market investing is paved with informed, well-calculated decisions.
Questions and Answers
Q. How to identify trends in the stock market?
A. When the stock market is moving up and down, when there is a sequence of higher high price points and higher low price points that is a uptrend or a bull market. When there is a sequence of lower high price points and lower low price points that is a downtrend or a bear market.
Q. What is the 7% rule in stocks?
A. The 7% rule, says that if the price of a stock drops below 7% of the price you paid, you should sell the stock.
Q. How do you predict a trend in the stock market?
A. Generally, past price movement can serve as a predictor of future price movement. If the trading volume increases when price moves in one direction, then that indicates that the price movement is valid and likely to continue. If volume is declining then that indicates a weak price movement which could readily reverse.
Q. Which indicator is best for trend direction?
A. There is no clear winner among market price indicators. Individual traders have their own favorites, Some say Bollinger Bands are the best for indicating price trend, others prefer to rely on moving averages.
Affiliate Disclosure: This article contains affiliate links. If you click on a link and buy something, I may receive a commission. You will pay no more so please go ahead and feel free to make a purchase. Thank you!
It has often been said that there is no better investment than your own financial education. One great way to accelerate your financial education and your investing success is with the American Association of Individual Investors, the AAII. When you join the AAII, you get access to reports, courses on investing, risk management, asset allocation, retirement planning, managing retirement finances, and other resources, all for a single annual membership fee.
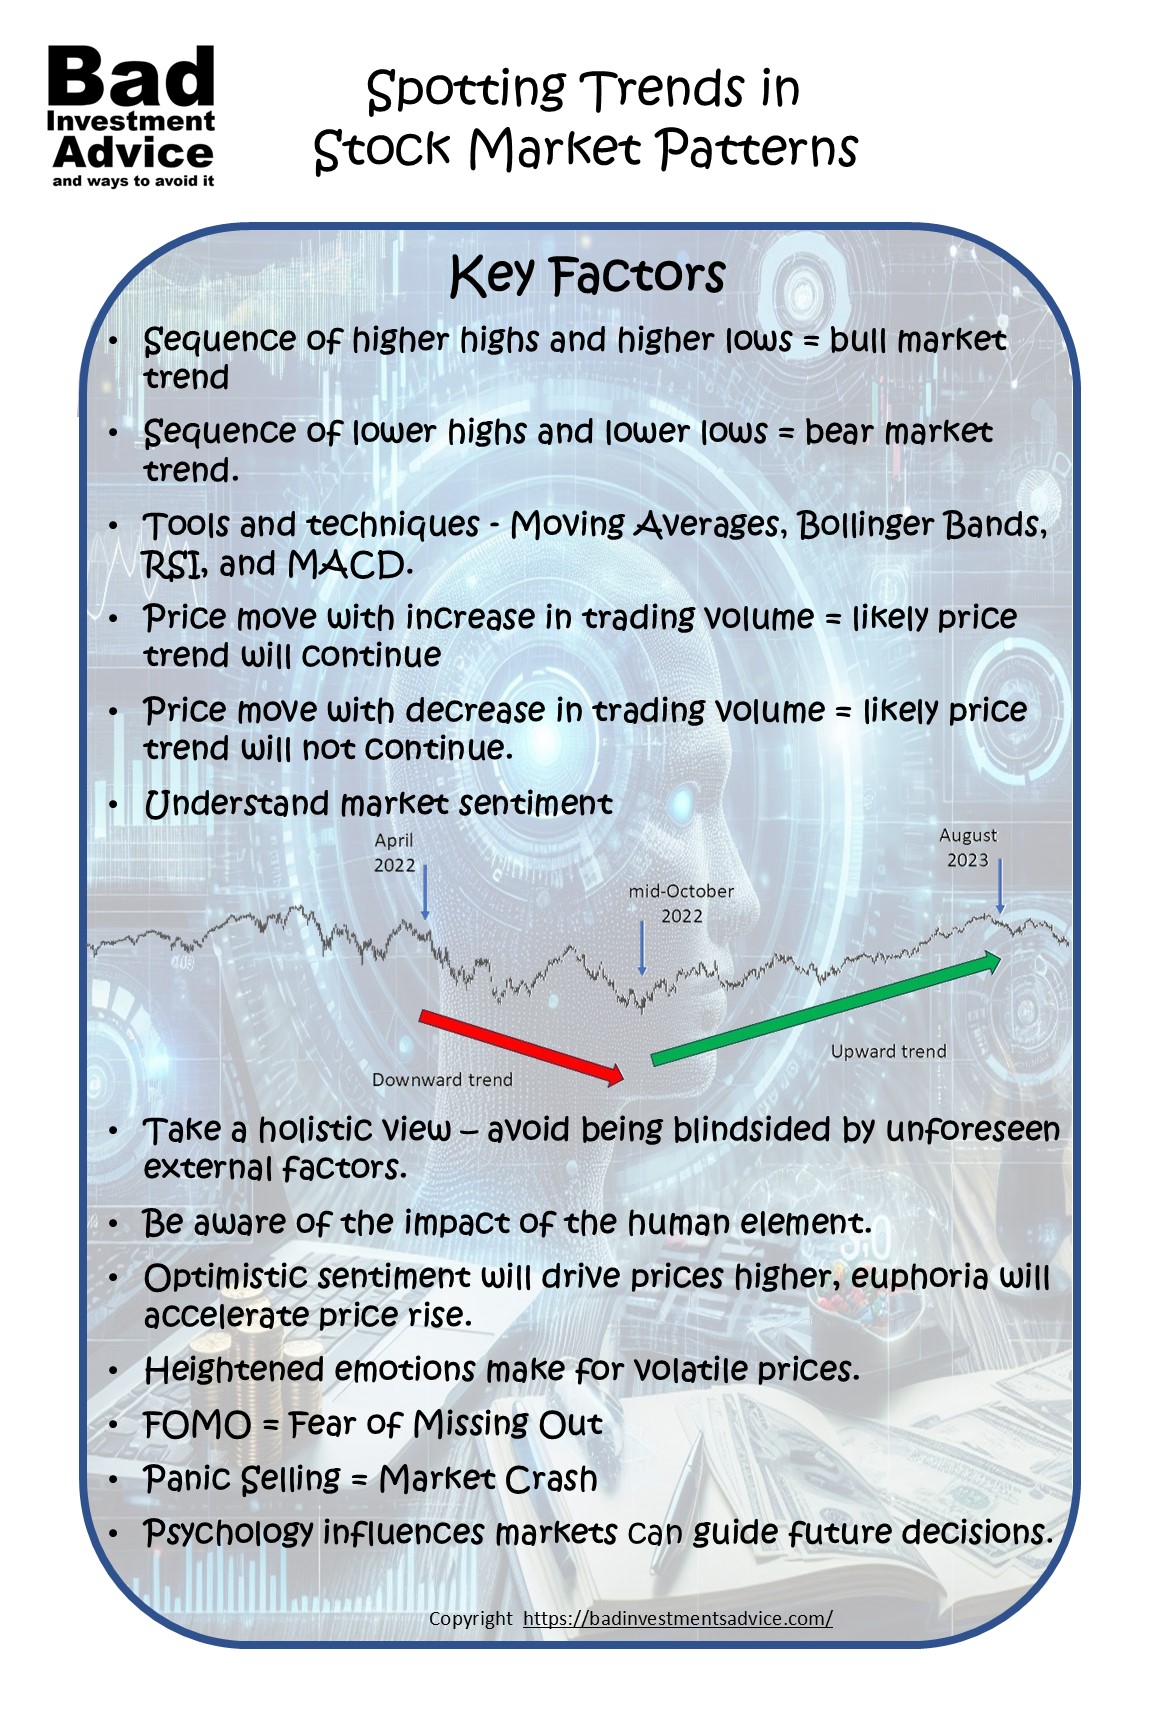
Single-page Summary
Here is a single-page summary of how to spot stock market trends. You can download a pdf here.
I hope you found this article interesting and useful. Do leave me a comment, a question, an opinion, or a suggestion and I will reply soonest. And if you are inclined to do me a favor, scroll down a bit and click on one of the social media buttons, and share it with your friends. They may just thank you for it.
You can also subscribe to email notifications. We will send you a short email when a new post is published.
Disclaimer: I am not a financial professional. All the information on this website and in this article is for information purposes only and should not be taken as personalized investment advice, good or bad. You should check with your financial advisor before making any investment decisions to ensure they are suitable for you.
Affiliate Disclosure: This article contains affiliate links. If you click on a link and buy something, I may receive a commission. You will pay no more so please go ahead and feel free to make a purchase. Thank you
-Here again to comment, bud. $$
-So we obviously talked about trends in the stock market; both bear and bull trends.
-We talked a little bit about the human element and how to not let our emotions dictates our behavior when it comes to trading on the market.
-I’d say I got a good amount out of this one, my friend; I really appreciate it.
-Best,
ALEJANDRO G.
Thanks for reading and taking the time to comment. I am glad you found it interesting.
I can’t help thinking that some of our politicians could do with studying your articles. Ever though of putting it all together in a book?
Yes I have thought of a book. I’ve spent quite a bit of time developing pretty pictures to make it a picture book. On the to-do-list.