There has been a lot of buzz in the investing and trading community in recent years around momentum investing. But if you were wondering what’s momentum investing, and you try to search on the topic you may become quickly frustrated.

Beyond simple definitions and introductions, in order to get acquainted with almost any complete momentum investing system, you’ll likely find you are asked to sign up and pay a subscription. Or, and frankly, I find this worse, you are made to sit through endless video testimonies of how people turned their lives around through trading a specific momentum system. These testimonials often feel overdone and more like a Country and Western song being played backward.
Momentum investing definition
The definition is simple and you could say just another expression of Newton’s laws of motion. Stock prices behave much like cannonballs, comets, or billiard balls. A stock in motion in a particular direction, whether that is up or down, will tend to continue in that direction unless acted on by a force or some other factor.
Momentum investing makes friends with the trend. Momentum investing uses technical indicators to determine when a trend is setting in and likely to continue. A momentum investing system usually applies a set of rules for entering positions, setting stop-loss levels, and exiting positions to take profits.
It can sound seductively automatic and easy and in some ways that is true, … depending.
Principles …
Rules
One of the key principles of momentum investing is to use rules. That is, use rules very strictly and avoid any emotions that may intervene and push you to bypass or bend the rules. There is an important issue at play here.
Emotions
It has long been observed since the market bubbles and crashes of the 17th century to the present day that prices rise on waves of greed, or fear of missing out and then collapse on fear of being wiped out or on the greed of aggressive and speculative short-selling.
Every trade has two sides. For every buyer, there must be a seller. So whatever position you take in the market based on whatever opinion or probable result you foresee, you need someone else to take the opposite side.
In momentum investing, more often than not the person taking the other side of your positions is being driven by emotions. Rather than try to manufacture an opposite emotion in yourself, if you are following a momentum investing approach you are better off eliminating emotions altogether.
Because the other sides of your momentum trades will likely be held by people following emotions that you read in the price action, momentum investing relies on the principle that the emotions lend probabilities to subsequent price direction.
Expectancy
Another principle that is common among momentum investing systems is that you don’t necessarily need to win more trades than you lose.
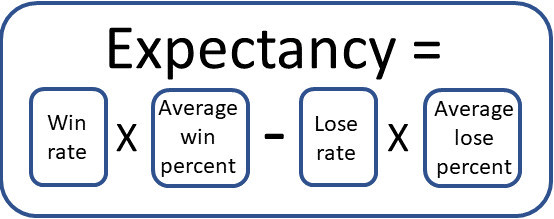
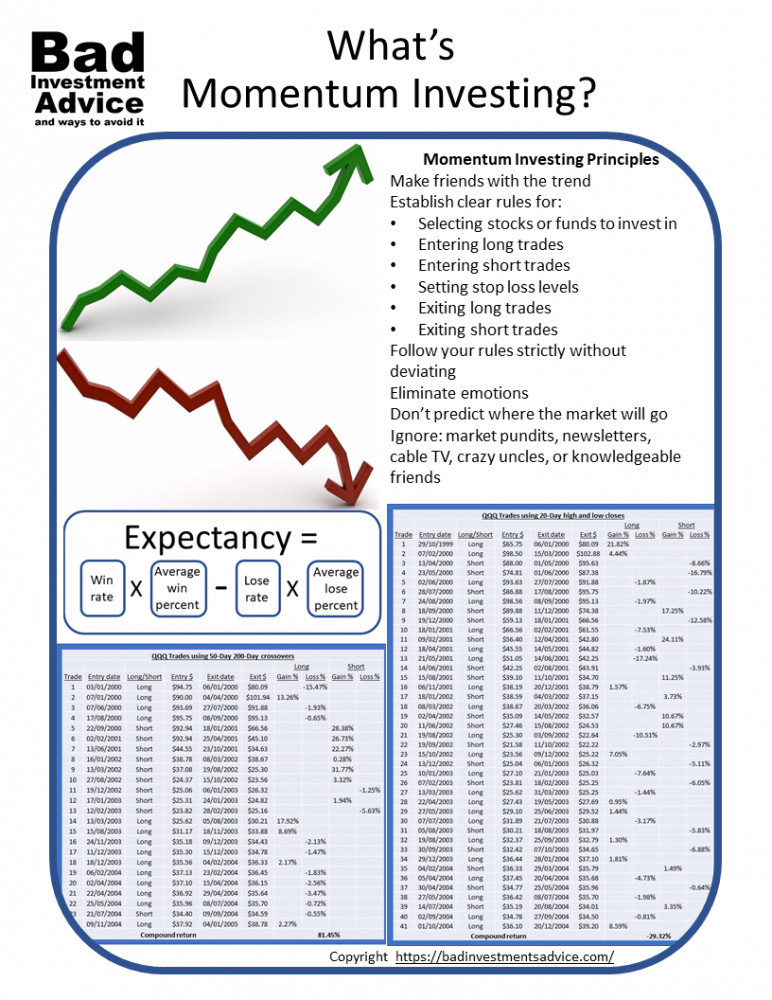
What you do need is for your win-frequency multiplied by your average return on each winning trade to be greater than your lose-frequency multiplied by your average loss on each losing trade. The resulting difference is your expectancy.
Here is that mouthful expressed as an example.
Let’s say you win on just 20 percent of your trades and lose on 80 percent
Let’s say when you win you average return is 70 percent
Let’s say when you lose your average loss is 5 percent.
Your expectancy = (0.2 x 0.7) – (0.8 x 0.05) = 10 percent
So even though you win only one trade in every five, because you winners bag a much bigger win than you losers lose, you are still ahead at the end of the day.
Here is that again expressed as an equation.
Back-test
Unless you are able to take a large data set of historical prices and write a computer program to back-test a trading system, the chances are you will be taking someone else’s word for it.
But you do want to give yourself some assurance that whatever momentum trading system you are thinking of using has been thoroughly back-tested against representative historical price data. You want to be sure that the trading rules have been tested and shown to work in bull markets, bear markets, and in market-topping and bottoming i.e. distribution and accumulation stages. If you are not sure what these terms mean here is an article on market cycles that explains the different stages.
Because momentum investing is usually very rigidly rules-based, back-testing is an important bar any system should pass.
Here is where you might have to exercise some judgment.
Historical performance vs actual performance
Momentum investing was all the rage back in the 90s. Then a number of mutual funds that were investing using momentum strategies had some bad years. What became clear was that back-testing a system has some pitfalls.
You have to be sure that the historical data you are using includes stocks that failed and were either wiped out or bought out. In other words that the data set you are using isn’t benefiting from the wisdom of hindsight and includes the dogs and failed ventures of yesteryear.
You also have to factor in transaction costs and general slippage. You can’t assume that every transaction will be executed at a quoted market price. If your system involves a large turnover, transaction costs and slippage should be factored. You should remember this when you look at example systems.
Mindset
Much of what is written on momentum investing strategies ends up devoting many pages to trying to get the wannabe momentum investor into the right mindset. This mindset involves a rigid adherence to the rules, ignoring any emotions you may have, following the trade enter, and exit signals as if your life depends on it. Judiciously ignoring any investment newsletters, cable news channels, and whatever investment advice you may get from crazy uncles or knowledgeable friends.
You will be told that you have to develop a zen-like equanimity to the outcome of any trade. You should not try to predict how the market will move. You only react to and follow the signals that the momentum investing system generates.
So much for the esoteric stuff, let’s look at some real momentum investing systems.
System 1 – moving averages
We can build a momentum investing system using 50-day and 200-day moving averages, abbreviated here to MA.
Upward trend
Entry rule: When the 50-day MA crosses above the 200-day MA as long as the price is above the 50-day MA that is an entry signal to go long.
Stop-loss rule: Stop loss is set a full 15 % below purchase price.
Exit rule: Long positions are exited when the price has increased fourfold or if the 50-day MA crosses below the 200-day MA.
This approach can be used to trade on the short i.e. bear side but it is not advisable for beginners. You need to set the stop-loss level very high and this system relies on holding trades for long periods.
If you do trade this system on the downside, i.e. just reverse the above entry rule for going short. OK, I’ll spell this out.
Downward trend
Entry rule: When the 50-day MA crosses below the 200-day MA as long as the price is below the 50-day MA that is an entry signal to go short.
Stop-loss rule: Stop loss is set a full 15 % above the entry price.
Exit rule: Short positions are exited when the price has decreased fourfold or if the 50-day MA crosses above the 200-day MA.
The issue with holding short positions is that your broker will be charging you interest. That interest charge is going to cut into your profits and the longer you hold a short position the greater the interest charge will be.
Financial whizzes may counter this rationale by pointing out that you should also be factoring the opportunity cost of your capital held in long positions at the prevailing interest rate. OK true but the interest rates we receive on interest-bearing accounts are almost negligible whereas the interest a broker will charge on short positions will be like running a checking line of credit.
My point is that this is dodgy territory unless you know what you are doing and probably better left alone especially for a beginning investor.
System 2 – price high and low comparisons over set periods
Another momentum investing system uses 20-day and 10-day price high and low closes.
Upward trend
Entry rule: If the price closes above the highest high over the last 20 days enter a long position.
Stop-loss rule: Set a protective stop-loss order at 15 percent below the entry price.
Exit rule: If the price closes lower than the lowest low over the last 10 days exit the position.
Like in the previous example, the whole system can be seen in reverse for short positions. Again the same caveats would apply. If you are new to trading and investing it would be wise to wait until you have gained experience before starting to short-sell.
Downward trend
Entry rule: If the price closes below the lowest low over the last 20 days enter a short position.
Stop-loss rule: Set a protective stop-loss order at 15 percent above the entry price.
Exit rule: If the price closes higher than the highest high over the last 10 days exit the position.
Other triggers
If we wanted to we could certainly construct other momentum investing systems using the MACD, the RSI, the ADX, the Stochastic oscillator, or any combination of these. But the two examples shown above are fairly commonly used so we’ll stick with those.
Sectors
It is generally accepted that the stocks likely to exhibit the best uptrends are growth stocks. During bull markets, the best growth stocks tend to be in the sectors leading the bull market. One way to identify the leading sectors is their relative strength when measured against the market. The easy way to do that is to plot the performance of the main sector ETFs against a major market index such as the Standard and Poor’s 500 or the NASDAQ Composite.
The same principles work in reverse in a bear market. The weakest sectors also plunge the lowest in a bear market. Again the easy way to find the weakest sectors is to plot their relative strength against a major market index using sector ETFs.
Where to find momentum stocks
We could cast our net very wide and consider the available universe of liquid stocks. Another approach is to look for stocks that stand a good chance of running up very high. Assuming these are the kinds of stocks we are looking for, the place to find them is among the leading stocks in the leading sectors.
Looking back on the last five years or so, that is up to October 2020, the leading sectors have been technology and for some of the time healthcare.
Sector Rotation
There is another approach to momentum investing that takes more of a buy-and-hold approach.
Since the evidence shows that strong sectors lead bull markets and those sectors tend to stay strong for many years, a simpler approach is to invest in the leading stocks and ETFs of the strongest sectors. Then to rotate out of the sectors that fall back and into the sectors that take the lead.
We’ll take a closer look at the sector approach in another article.
DFY vs DIY
There is a simpler approach to momentum investing. Instead of Doing-It-Yourself, there is the Done-For-You approach. A simple Google search on – Momentum investment funds – will bring up a long list. Just investing in a selection of these funds will also give you a portfolio that follows a momentum strategy.
Strategies in action
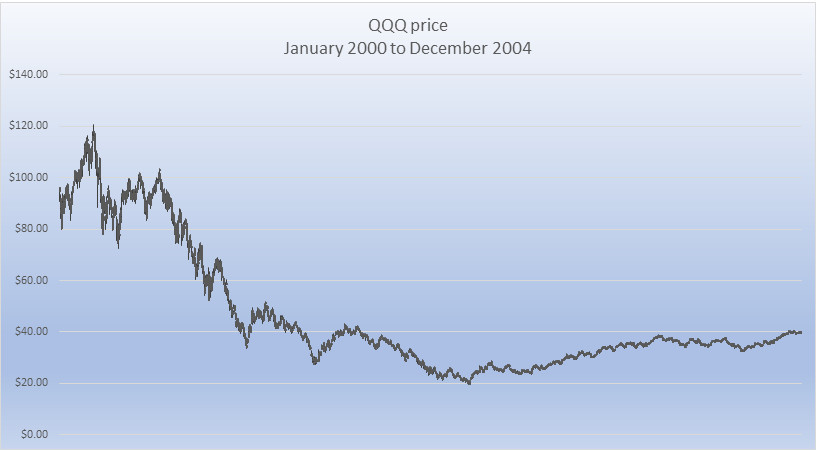
For the purposes of simulation let’s test, system 1, the moving average system, and system 2, the price high and low system against 5-years of historical price data for a major ETFs in the technology sector, the Invesco QQQ Trust which goes by the symbol QQQ. Here is what the QQQ price did between January 2000 and January 2005.
Source1)Historical stock price data source: Yahoo Finance, all charts and trade calculations by https://badinvestmentsadvice.com/
On the face of it, this looks like a fairly typical price chart. The period starts in a bear market that fell from a high of around $120 over a three-year period to a low of around $20. The last two years saw a gradual rise from $20 to around $40. If you had bought and held QQQ for that five-year period you would have seen a total return of minus 61.75 percent i.e. a loss.
Comparing our two systems
Now let’s see what you have happened if you had followed system 1 using entry and exit signals of the 50-day moving average crossing the 200-day moving average, trading both on the long side, and on the short side. These are the trades that you would have executed.
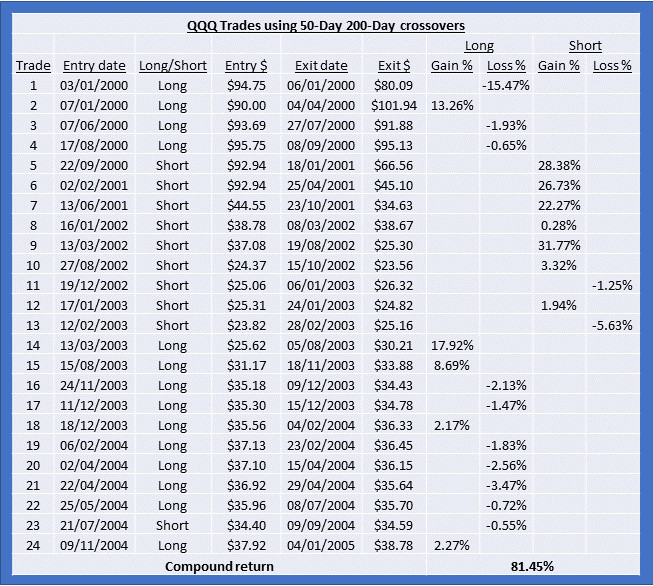
We can see that this system resulted in a total of 24 trades, 14 on the long side and ten on the short side. Five of the long trades were winning trades and ten were losers, while seven of the short trades were winners and two were losers.
It is also worth noting that only one of the losing trades was triggered by hitting the stop-loss level. All other trades were closed because the 50-Day moving average crossed the 200-Day moving average.
Overall, when the returns of those 24 trades are compounded, we get a positive return of 81.45 percent. That is pretty good compared to a loss of 61.75 percent.
System 2 with the Q’s
Now let’s look at how the other system would perform for the same ETF over the same period.
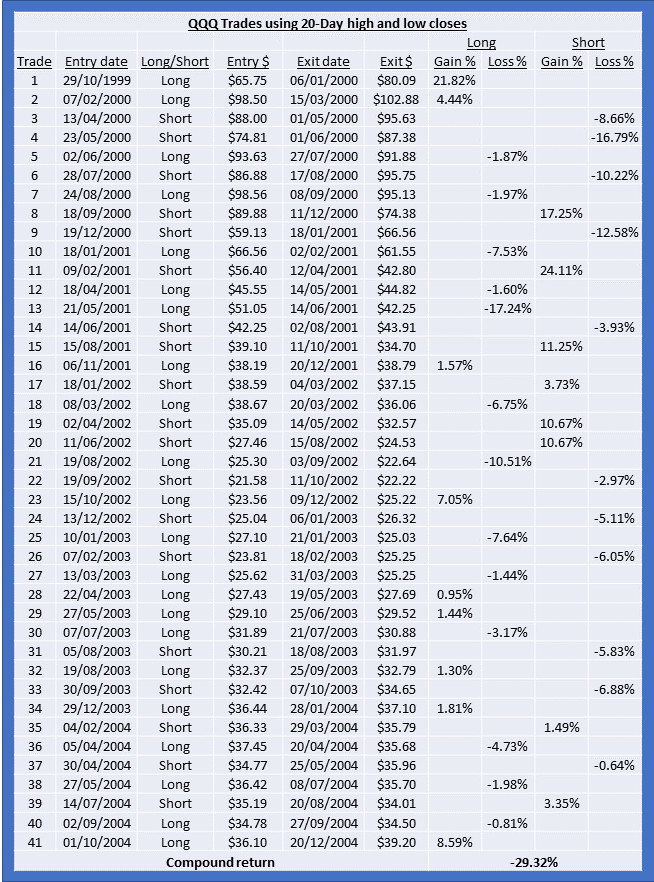
So here we have a total of 41 trades, 22 trades on the long side, and 19 trades on the short side. Nine of the long trades were winners and 13 were losers while eight of the short trades were winners and 11 were losers. The compounded result of all those trades was still a loss of 29.32 percent. I find that pretty poor to be honest.
Working through all of those trades, system 2 seemed to be getting into a long position exactly when a short would have been better and vice versa. Again I note that only one trade was closed because the price hit the stop-loss level. All others were closed because the price closed either below the 10-day low on the long side, or above the 10-day high on the short side.
As I say I thought this was pretty poor. Especially as this system should be able to extract profit from price declines just as well as from price rises.
Same systems, different period
To be thorough, let’s see how each of these systems performed over a bull market. Here is the price action of a much later 12-month period from the beginning of September 2019 through to the end of August 2020.
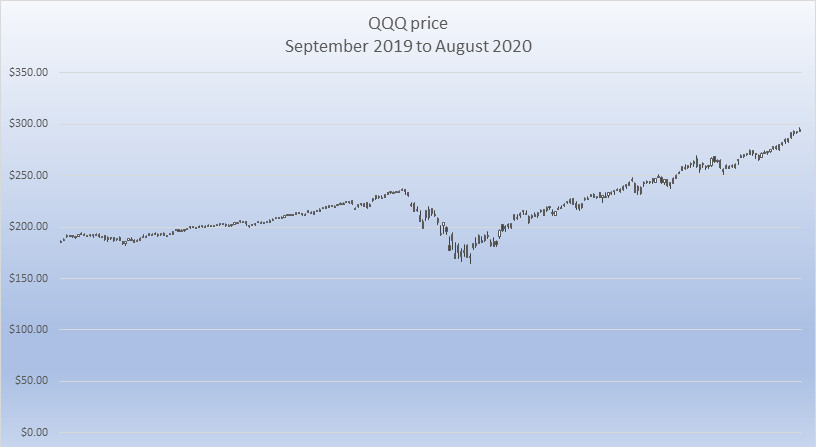
We will recall the familiar price pattern. QQQ is an ETF leading the bull market over recent years, so the price-performance is strong. If we had bought and held this fund from the beginning of September 2019 through to the end of August 2020 we would have seen a return of 58.84 percent. Let’s face it that would have made for some very happy buy-and-hold campers.
Here are the trades that our 50-Day and 200-Day moving average system 1 would have executed.

So a total of four trades, all long with one losing and three winning trades resulting in a compound return of 48.26 percent.
Here is how system 2 that compares closing prices with the highest and lowest prices over the previous 20 days, would have performed.

A total of five trades, two long, three short each with one losing trade, and the rest winners yielding a compounded result of 61.48 percent.
What to conclude?
It doesn’t surprise me that the results of this limited back-testing are not conclusive.
Firstly, if it really was as simple as running these kinds of automated trading systems to consistently extract profits from the markets everyone would be doing it. So while this may be heresy to the committed momentum system investor, it does look as if the systems need more refinement to be universally applicable.
Or maybe it doesn’t make sense to try to find a system that is universally applicable, rather it is a better application of this method to study the price patterns of a few specific stocks, funds, or commodities and find a system that works the best over equal periods throughout the price history of those specific stocks.
Then as long as history repeats itself, we should do well. Sorry, that was a bad joke.
On the other hand, it could be argued that the moving average system performed acceptably well under most conditions. Even though it did not perform as well as just buy and hold in a sustained bull market, the fact that it handled a declining market very well is a good sign. If you expect that the price patterns of the stocks or funds you will be trading move mostly up and down much of the time and sideways some of the time, then a moving average system could be used.
It is also likely that the 50-Day/200-Day moving average system worked well for QQQ because of the way this fund trades. A system that is based on 20-Day and 10-Day prices is going to be better tuned to short-term price movements.
Room for adjustment
I would also be inclined to test the stop-loss level A 15 percent stop-loss is quite high and we saw that it only triggered very rarely. That suggests these systems might work better with a tighter stop-loss level.
I would also be tempted to change the periods of the moving averages. 50-Day and 200-Day crossovers are quite slow and are likely to be revealing intermediate to long term effects. Shorter-term moving averages, like 20-Day and 40-Day crossovers, may work better for shorter-term, more volatile, and erratic price movement stocks and funds.
Here is an article that gives a little more of the history of momentum investing.
Answers to questions
Q. Is momentum investing a viable strategy?
A. Yes. Momentum investing can work, there are many variables though. If you are going to pursue a momentum investing strategy, then you will need to match your approach to the kinds of stocks or funds that you are investing in. If the stocks and funds are slow-moving, then you will want a momentum system tuned to longer-term signals. If you are investing in more volatile stocks then your system should match.
Q. What is a momentum stock?
A. A momentum stock is a stock that tends to move steadily in one direction, either increasing or decreasing in price over a specific time horizon.
Q. What causes stock momentum?
A. Stock prices are driven by fundamental valuations, expected earnings, and emotions. Institutions accumulating or distributing stock will tend to push a stock price in one direction over time. This tends to happen over time since institutions spread their buying and selling over many trading days to avoid moving prices suddenly.
Here is a single-page summary of momentum investing as a PDF download.
I hope you found this article interesting and useful. Do leave me a comment, a question, an opinion, or a suggestion and I will reply soonest. And if you are inclined to do me a favor, scroll down a bit and click on one of the social media buttons, and share it with your friends. They may just thank you for it.
Disclaimer: I am not a financial professional. All the information on this website and in this article is for information purposes only and should not be taken as investment advice, good or bad.
Affiliate Disclosure: This article contains affiliate links. If you click on a link and buy something, I may receive a commission. You will pay no more so please go ahead and feel free to make a purchase. Thank you!
References
| ↑1 | Historical stock price data source: Yahoo Finance, all charts and trade calculations by https://badinvestmentsadvice.com/ |
|---|
Wow, great information! Thanks for sharing this, really made me think.
Hi and thanks for the comment. Best regards, Andy
Hi Andy. Interesting stuff. I’ve always taken an interest in my own finances (picking my own investments for pensions and IRAs rather than relying on, and paying commission to, financial advisers) and have read about many ‘systems’ over the years. I came to the same conclusion as you – “… if it really was as simple as running these kinds of automated trading systems to consistently extract profits from the markets everyone would be doing it …”. I avoid such systems and invest in a broad range of ETFs – slow and steady growth is fine with me 🙂
Hi Richie
I agree with you. Searching for these magical profitable trading systems can be a bit like searching for the Holy Grail. I am also heavily invested in a range of ETFs. Thanks and best regards, Andy
Wow, Andy! Reading your post took me back to an economics class in high school. I was interested at the time, but in the end, I chose literature for Uni. That explains why my investing, stocks and markets knowledge at the moment is completely missing:)
On the other hand, you do have the knowledge and a way to make it easy to understand even to a lost cause, like me!:)) I might have studied literature, but I enjoy a social or financial read in plain English just as much! Congratulations on this article!
Hi and thanks for stopping by. Now your comment has taken me back to the time when I was deciding what to do for undergrad studies. At some point, I decided it was going to be electronic engineering though the decision was a bit random at the time. I remember travelling the country to visit universities with other would-be students and getting into a conversation with someone on the train. He said to the others – you are doing the right thing going for electronic engineering. But then he turned to me and said – but not you. You should be doing philosophy of science. Maybe he was right all along. Will I ever know? At least I like a good mystery. Thanks again and best regards, Andy
Hi Andy!
Wow, there’s a lot of great information in here. I like how you describe how to trade in different market conditions using momentum investing.
It seems to be tied very closely with technical analysis, and it is smart to have clear guidelines and stats using historical chart data to make trading decision in order to avoid the traps that emotions can play once you see a stock jumping up or down.
I have not yet used stop loss orders or had to deal with paying interest for shorting stocks. I deal mostly with options so I am not sure if the same rules apply as there is typically only a fee for closing trades with my broker. Is the interest tied to stop orders?
Warm regards,
Sonia
Hi Sonia
Thanks for stopping by. Yes, the momentum trading systems that I looked at use technical analysis to trigger trade entry and exit.
I do use stop-loss orders on options but you have to be careful as options can fluctuate much more in price than the underlying. So it is often much better to use conditional stop-loss orders. In other words, you execute a stop-loss exit on an options position, if the price of the underlying hits a certain value. Like you, I don’t sell stocks short but I do purchase put options.
I use ETrade and they only charge fees on executed options orders. So there is no charge to hold an order open or to place an order in their system. You are only charged the fee of $0.50 per option when the trade is executed.
Kind regards
Andy
Hi Andy, this is a very well researched and detailed post. I think when it comes to investing, a lot of people focus on returns, whether it’s short term or long term. Basically i see 3 types of investors. Type 1: Buy and hold. Type 2: Short sales/day traders. Type 3: Gamblers. When i invest, i want to be able to find a balance between gain and tax efficiency. With the new administration coming onboard in the US, and the probability of eliminating long term capital gain tax, i think a lot of investors will focus on the short term games and this makes your article all the more interesting. Thank you for the post. Keep up the good work!
Hi Walt and thanks for the comment. I had designed my investing approach for many years making use of the tax advantages of capital gains vs short term. I would hold all positions for 13 months and the only way I held for less was if there was an acquisition. It actually used to irritate me greatly when I did have to pay tax on short term gains because of an acquisition. But then the system I was using stopped working as well about a year ago so I stopped using it. So, according to your scale, I used to be exclusively a type 1 investor, now I am much more of a type 2 though I do have some positions I am building that I will hold for the long term. I just hope I don’t end up as a type 3!
Thanks for the encouragement. I will be adding articles on other styles and systems of investing in the coming days so I hope you come back. Best regards, Andy
I think this is one of the best ways to actually get involved in the market. Being able to know when to invest and not to invest and the steps to take and what to focus on when investing is just awesome to see here. I like the overview of what you have shared here and I will definitely try to stick with this better. Thanks
Hi Tracy and thank you for stopping by. I am glad that you found the article interesting. I will be adding more articles on different approaches to investing and trading shortly. I hope you will come back. Best regards, Andy
Thank you for another rich article. I am new in stocks and trying to understand the whole concept of momentum investment. Since it is geared in a particular direction until something happens. And you map out its principles to include rules, emotion. Like you also identified that one need to take a side, can I consistently work by rules and not emotion?
Hi Ayodeji and thanks for the comment. Almost every approach to investing works better when we are able to put our emotions to one side. This is arguably more the case with styles like momentum or trend-based investing because many of these systems work with a higher percentage of trades being losers than winners. So the only way to stay profitable overall is to keep the losses on the losing trades to the bare acceptable minimum and that inevitably requires that we ignore emotions. I hope this helps. Best regards, Andy
Thanks for this very educating article on what momentum investing is all about. I have read some of your articles and j must say I like the way you give a question and answer section at the end of your articles. Haven read this brilliant article, I would love to ask if momentum investing is only applicable to stock trade?
Hi and thank you for your positive comments. It is very gratifying to receive this positive feedback and I thank you for that. Momentum applies to all markets where a large number of traders, i.e. buyers and sellers are driving prices. You will see similar price and volume patterns in forex, commodities, and in cryptocurrencies, because it is the effect of human emotions that is being observed. While there will always be tendencies in the markets to drive prices to a mean, the presence and action of emotions tends to drive prices to swing back and forth between price resistance and support levels. Another way to look at resistance is that this is the point where sellers win the battle with buyers and support is the point where buyers win the battle with sellers. Best regards, Andy
Since institutions spread their buying and selling over many trading days to avoid moving prices suddenly, is there a way to know beforehand how institutions will be buying and selling? Have there been people with access to this type of information along history? It would be interesting to know about this.
Hi and thanks for the comments and question. The most recent example of an indication of where institutions are accumulating positions is probably the first week of trading after the results of the US presidential election were clear. So that was the week of November 9 to 13. One of the best indicators is the trading volume. What you tend to see with stocks that are being accumulated by institutions is large spikes of volume when the price hits a particular level of support. But the other thing to check with a stock is in the published reports, the number of institutions that hold the stock, Of course, this data is a couple of months out of date by the time it gets published and some institutions will try to cloak their actions knowing this fact. But generally, if you are looking at a potential growth stock for signs that it might be breaking out and heading on a long bull run, you will want to see that the number of institutions holding the stock increases quarter on quarter. As regards the history of watching these things, Jesse Livermore was one of the early masters of this art.
Here is a detailed review of how Jesse Livermore operated
It is interesting to note that in Jesse’s time all they had to go on was the stock tickers and the stock tickers only give three pieces of information in addition to knowing when a trade happened. The stock symbol, the price traded and the number of shares traded. Also in his day, institutions, or insiders as he called them accounted for around 50 to 60 percent of the trading volume. Whereas today, institutions account for closer to 90 percent of the trading volume.
Thanks again for the question, Best regards, Andy
Hello there! Thank you for another rich article. I am new in stocks and trying to understand the whole concept of momentum investment. Since it is structured in a particular direction until something happens. And you map out its principles to include rules, emotion. Like you also identified that one need to take a side, can I consistently work by rules and not emotion?, I just want to know about these questions.
Hi Maureen and thanks for the comment. The generally accepted position is that the more you work with statistical and mathematical rules and methods and the less judgement is involved in your trades the more important it is to eliminate emotion from the process. Many momentum trading systems have a higher proportion of losing trades than winning trades. So it becomes even more important to minimize the losses on the losing trades since there are just more of them. Emotions will often interfere and find a justification to hold onto losing positions in the hope that they will come back. Usually, they don’t and you just end up losing more. Thanks for the question and best regards, Andy
Hi and thanks for stopping by and leaving this comment and thank you for subscribing. I will be adding more articles on different aspects of investing and trading shortly.
Best regards
Andy