Understanding implied volatility of options is something all options investors and traders will need. Volatility is an important measure for options traders because it is the volatility that gives opportunities for profit. When you are looking to open an options position, one of the key metrics you will look at is the implied volatility.
3 kinds of volatility
In regard to market prices, there are three measures of volatility to consider.
- The first is historical volatility, which looks at how returns have fluctuated in past periods.
- The second is what the actual volatility will be in the future. This is what all traders want to know and nobody does know until it has happened and becomes actual and historical volatility.
- The third is implied volatility which is what this article is all about.
So firstly, what does implied volatility mean?
The implied volatility is the volatility in the price of the underlying stock or ETF that is implied by the market price of a call or a put option given the current market price of the underlying, the strike price of the option, and its time to expiry.
This statement says a lot so it is useful to look at this from a few angles.
While there is a market in the underlying stock or ETF there is also a market in options on the underlying stock or ETF. So there are two sets of buyers and sellers. While many of the buyers and sellers will be the same, some will be different.
What does all that mean?
If any of the terms being used here are strange for you, this article explains how call and put options work.
Different markets
That is likely to mean that there will be some different sentiments at play in the market for the underlying and other sentiments impacting the market for the options. That, in turn, means there will be opportunities to profit if you can find mispriced options.
I will admit this observation runs counter to an economic theory called the efficient market hypothesis. The efficient market hypothesis states that everyone in the market has access to all information and prices fully reflect all information all the time. But then again, there are numerous reasons and there is a ton of evidence demonstrating that the efficient market hypothesis doesn’t hold water, but we can save that for another time.
Historical volatility
It is helpful to understand historical volatility first.
Historical volatility of a stock price is usually expressed as a measure of the dispersion of daily returns over a set number of days in the past.
There are a few other ways to measure volatility and perhaps to make our task easier we should first define the term volatility itself.
Volatility is a measure of the dispersion of results that happens in nature when you are repeatedly trying to hit a target and you don’t always manage to. There are of course more scholastic definitions like – the dispersion of a time series of variables about a mean value – But it is easier to explain if we take an imaginary everyday example.
Let’s say we keep shooting at a number on a scale. Sometimes we hit the number sometimes we overshoot slightly sometimes we undershoot slightly. Sometimes our aim is bad and we miss by a lot.
If we record all the numbers we scored we would end up with a series of numbers dispersed around the target number we were trying to hit. The distribution would most likely resemble a normal distribution shown here with the standard deviation.
Normal distribution
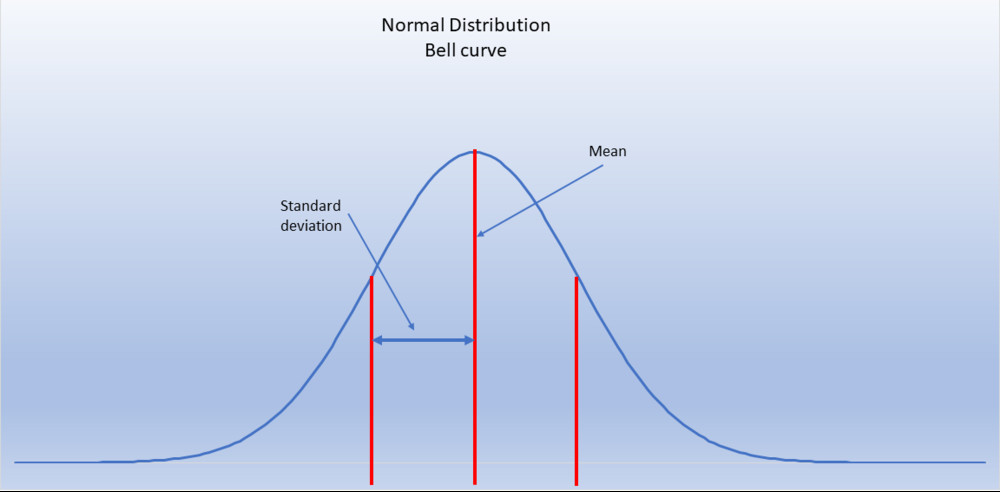
The normal distribution has the characteristic bell curve shape. Most of the data is clustered around the mean value but we could draw the bell curve as a narrow shape if our aim was good or as a wide shape if our aim was consistently bad or anything in between.
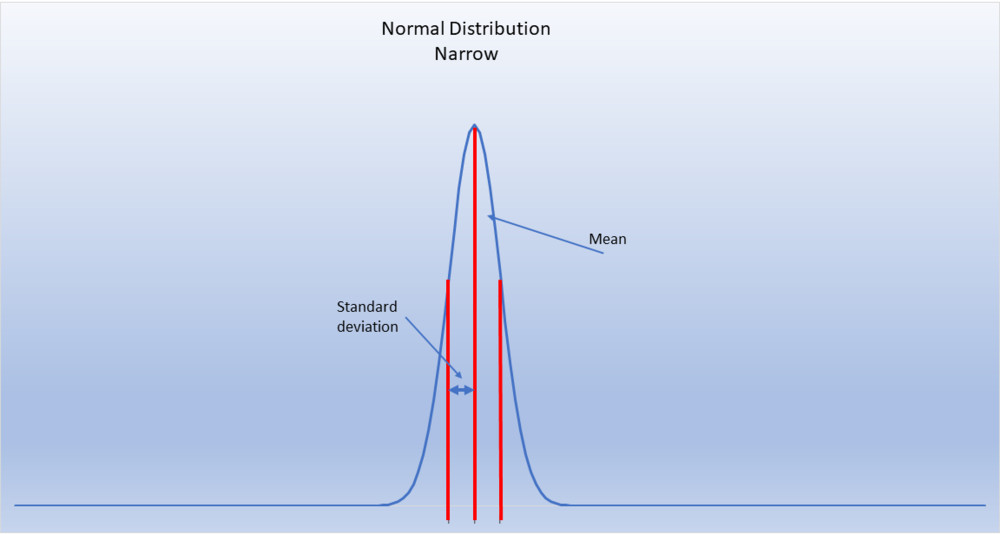
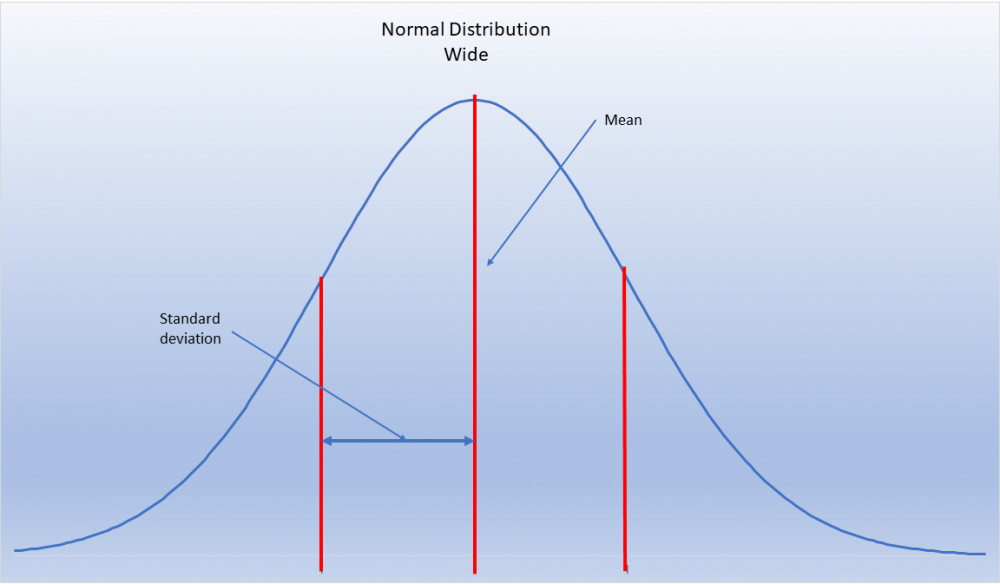
We express the spread of the bell curve by the standard deviation. The standard decision is that measure on a bell curve such that 68% of all data lies within one standard deviation on either side of the mean.
When we are using bell curves to represent stock prices, we can make the bell curves of different stocks comparable by expressing the standard deviation as a percentage of the stock price rather than in a dollar value. In this way, a low percentage standard deviation will give a narrow bell curve while a high percentage standard deviation will give a wide bell curve.
30-day volatility and the VIX
Historical volatility is the volatility of price returns looking back at the past. It can be expressed for any period, a year for example but to be useful in options trading we tend to look at periods of 30-day volatility at different points in the past.
The reason we look at 30-day volatility is that this is the measure published for the most-watched forward-looking volatility index, the VIX.
The VIX is an index that is calculated from the implied volatilities of a basket of options in the Standard and Poor’s 500 index, or the SPX. The calculation itself is complicated and uses options with different strike prices with between 23 and 37 days to expiry.
Effectively, the VIX is a collective representation of what a broad group of traders thinks the volatility of the Standard and Poor’s 500 index is likely to be over the next 30 days.
Back to 30-day historical volatility
There are many ways we can look at 30-day volatility.
We can look at the immediate last 30 days. We can look at 30 days a year ago and we can look at the 30 day period that had the highest volatility over the last year and the 30-day period that had the lowest volatility over the last year. All of these measures are useful and they are all measures of historical volatility.
Some examples
Just to put some meat on the bones, let’s look at historical volatility for a number of Exchange-Traded Funds or ETF’s and one somewhat notorious stock, GameStop Corporation to get a feel for what they look like.
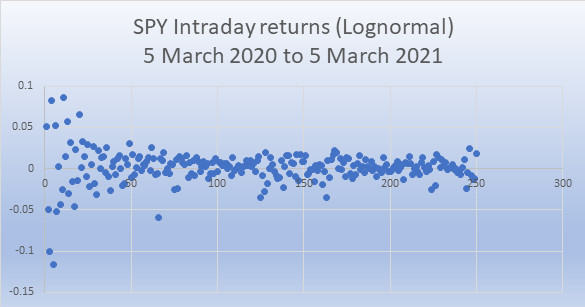
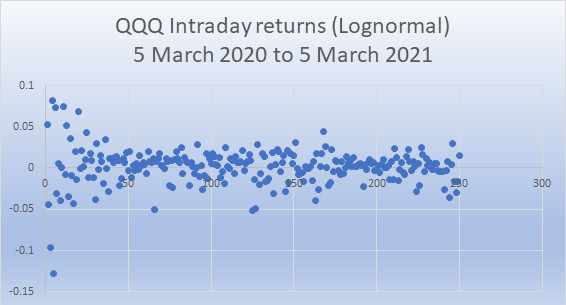
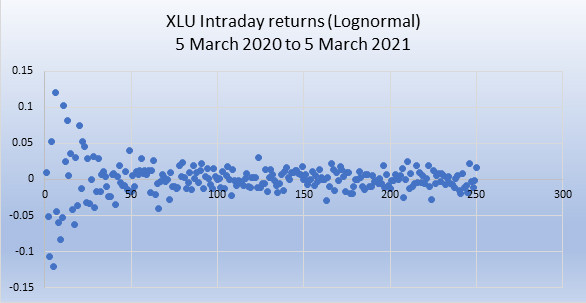
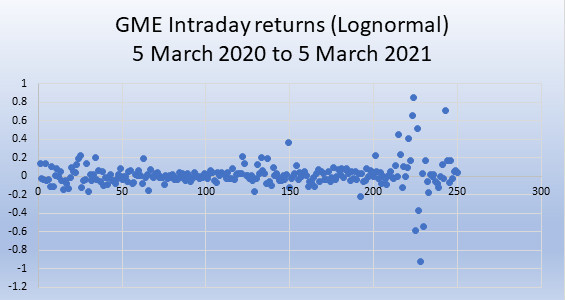
Here are scatter plots of the interday returns of three ETFs SPY, QQQ, and XLU, and one stock GME. All these show the period 5 March 2020 to 5 March 2021. We are using the natural logarithmic returns function. In each case, the intraday return is expressed as the natural logarithm of today’s closing price divided by yesterday’s closing price.
For small percentage changes in price, the logarithm returns function isn’t that different from the numerical return, if we just compare the price change as a percentage of the previous day’s price. But for statistical consistency, we should stick with the log function.
1)Historical Data source Yahoo Finance. All charts and calculations by BadInvestmentAdvice
- SPY tracks the large-cap Standard and Poor’s 500 index
- QQQ tracks the NASDAQ 100 index
- XLU is the SPDR fund that tracks the utilities sector
- GME is the stock symbol for GameStop Corporation
We can discern some visual differences between the three scatter plots of the index-tracking ETFs. We know from everyday market knowledge what to expect from these funds. We would expect the SPY to have a performance and volatility that is middle-of-the-road, QQQ we might expect to be more volatile, XLU we would expect to be less volatile and GME we would expect to see off the charts.
Clearly, you would really have to know what you are looking for to extract anything meaningful from these diagrams. It is hardly surprising then that nobody uses these for trading purposes.
Volatility data
If we look at the published volatility data and market prices for these ETFs and the stock this is what we see.

Data source: Power E*TRADE®
Because this is a snapshot in time taken at the end of a rather volatile week of trading we see some significant changes in implied volatility. It is also interesting to compare these volatility figures with the figures for the VIX itself for the same date. This is what that looks like.

Data source: Power E*TRADE®
What this tells us
There are a few things worth noting here.
Firstly, implied volatility consistently under-estimates historical volatility. We can see that from the respective 52-week highs and lows for each item.
But we would also make other somewhat surprising observations.
In fact, XLU, the Exchange-Traded Fund for utilities was actually more volatile historically than either the SPY or QQQ. Who would have thought?
We can look back with the knowledge of what happened over the last year and point to some likely explanations.
One obvious explanation is that utilities is traditionally one of those safe sectors. When market sentiment gets itchy, when traders and fund managers start to get nervous about rapid price declines, they want more insurance. So they will tend to take more positions in options that are just like insurance contracts. That pushes options prices up, which pushes up the VIX.
When large funds expect there could be rapid price declines they will move into the safer sectors like utilities.
Unlike retail investors who can essentially do what they want, institutional funds are bound by their own rules. Many of them are obliged to stay in the market and with set percentages.
So they don’t have the choice to just move everything into cash. They will tend to move into the safer sectors like utilities and that pushes the prices of utility stocks higher and those price moves can be dramatic.
So ironically, utilities and other safe sector stocks and funds like consumer staples can become themselves more volatile in times when the market is expecting a correction.
How to read implied volatility
The implied volatility of the underlying stock is calculated from the premium prices of at-the-money options. That calculation takes into account a number of factors.
- the strike price
- the current price
- the time to expiry
- the risk-free cost of capital which is the current base interest rates
- any dividends that the underlying stock or ETF will pay
- the premium of at-the-money options
There are a few calculation methods, one of the better-known ones being the Black Scholes model. This was considered so important that the authors were awarded the Nobel Prize for Economics. Let’s just say it’s rather complicated and leave it at that.
The important thing for us to know as traders is that we can read implied volatility just as if it is the standard deviation of probabilities around the current value.
Going back to statistical theory, if we see for example implied volatility of 20%, that means we can expect that for 68% of the time the stock price will be within plus and minus 20% of where it is now.
But remember, published implied volatility figures are always given as annualized figures. So if we are interested in what the price could do over a shorter period into the future we can convert the annualized implied volatility to get expected volatility for the period we want.
Calculating implied volatility for different periods
Let’s say we are interested in the next 30 days. The formula for converting annual implied volatility to a different time period is simple. We multiply the annual implied volatility by the square root of the number of days we want to consider divided by 365 days of the year.

So 20% annual implied volatility works out as 5.73%. So we can estimate that there is a 68% chance of the price staying between plus and minus 5.73% of the current price over the next 30 days.
Going even further, we can run the calculation for two standard deviations covering 95% of the time. Twice 5.73% is 11.47% there are some rounding factors here. That tells us that there is a 95% chance of the price staying between plus and minus 11.47% of the current price.
However, it may not be wise to take these calculations too far. The analysis is based on a normal distribution. The normal distribution assumes that price can vary infinitely on the positive side and infinitely on the negative side. That is not the case. While price can in theory go parabolic and through the roof many hundreds of percentage times, the price can only drop to zero. So the maximum price decline is in fact minus 100%. But the maximum price increase is theoretically infinite.
Lognormal distribution
For this reason, actual price variations are more likely to follow log-normal distributions, not normal distributions. Effectively there is a skew to the plus side.
That is good news for the bulls. It means you can go from rags to riches and the riches can be many times the value of the rags you started out with.
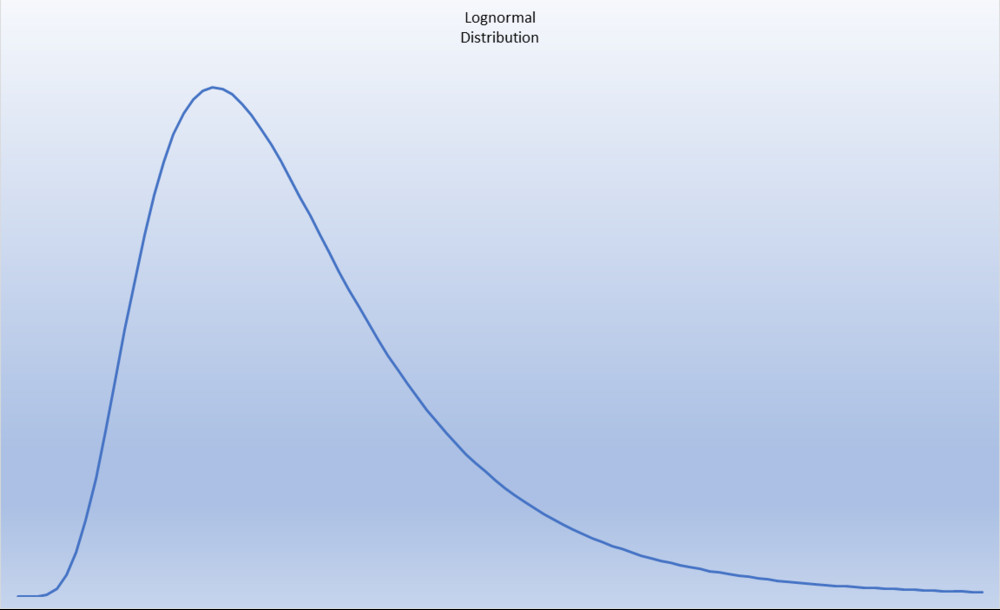
But if the market moves against you, you only lose your rags.
This article dives into the math of implied volatility.
Questions and answers
Q. How do you interpret implied volatility?
A. Implied volatility is what the market price says investors expect the volatility of the underlying price to be over the coming year. It is the expected volatility that is baked into the premium price of at-the-money options.
Q. Is high implied volatility good or bad?
A. High implied volatility is an opportunity to profit from high option premiums. That is good if you are selling options and expect them to expire out-the-money. It is bad if you have to buy options to provide insurance on your stock and ETF positions because the options you are buying will be expensive.
Q. Is implied volatility of 100% good or bad?
A. An implied volatility of 100% is high by any standard. That can be a good thing if you are selling the option that can be a bad thing for you if you have to buy the option. We do see figures of implied volatility of 100% or more at times when markets and stock prices are moving very rapidly. In annualized terms, It means there is a 32% chance that the stock price will either double or drop to zero over the next year.
Affiliate Disclosure: This article contains affiliate links, if you purchase through a link on this site, I may receive a commission.
Are ready to get serious about investing in your own financial education? Then check out membership of the American Association of Individual Investors, the AAII.
The AAII is a nonprofit organization, dedicated to the financial education of its members. Your membership of the AAII will give you access to courses and resources on stock investing, financial planning, and how to manage your retirement finances.
Single-page summary
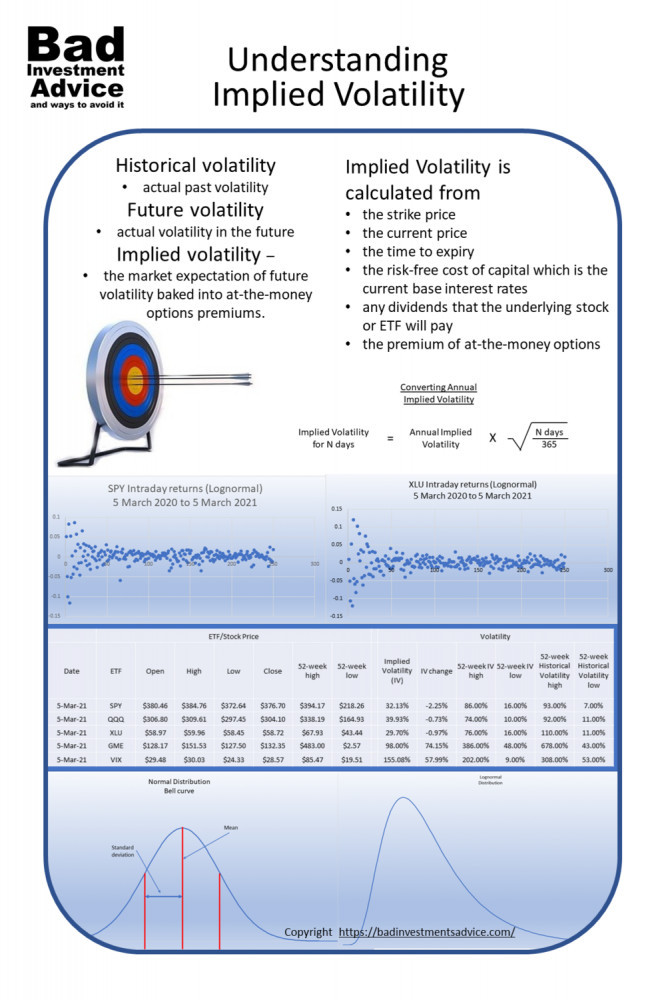
Here is a single-page PDF summary of the implied volatility of options.
I hope you found this article interesting and useful. Do leave me a comment, a question, an opinion, or a suggestion and I will reply soonest. And if you are inclined to do me a favor, scroll down a bit and click on one of the social media buttons, and share it with your friends. They may just thank you for it.
You can also subscribe to email notifications. We will send you a short email when a new post is published.
Disclaimer: I am not a financial professional. All the information on this website and in this article is for information purposes only and should not be taken as personalized investment advice, good or bad. You should check with your financial advisor before making any investment decisions to ensure they are suitable for you.
Affiliate Disclosure: This article contains affiliate links. If you click on a link and buy something, I may receive a commission. You will pay no more so please go ahead and feel free to make a purchase. Thank you
References
| ↑1 | Historical Data source Yahoo Finance. All charts and calculations by BadInvestmentAdvice |
|---|
Man I wish that I had read this article before I lost a bunch of money on GME!
I figured with all of the hype that it wasn’t going to last so I jumped in on some low puts just to see what would happen. No harm no foul if I lost a bit of money!
Had I understood what I was actually doing I could have made a bunch more!
I think it is safe to say that once you get one of those short squeeze situations, there is so much attention and so many institutions will be watching and participating that if you try to join the fray as a retail investor your chances of a good outcome are quite slim. The media talks about how the online chat group was able to band together, push the GME price up and force institutions to cover their shorts. What may not be so obvious is that you can bet there were other institutions piling in as well to create the short squeeze. There probably are many small investors and traders who made a lot of money quickly on GME. But that is like winning at Vegas the first time. It will set you up to take bigger risks and the chances are that will not end well a second time. Good luck, Andy
Hi! This was a good read! Summarizing things up, I could say implied volatility symbolizes the expected volatility of a stock over the life of the option. As expectations increase, or as the demand for an option surge, implied volatility will grow. Options that have high levels of implied volatility will result in high-priced option premiums.
Hi, and yes that sums it up. Of course, there are many complications under the surface and factors that play into options prices. I think it is interesting to see how implied volatility and historical volatility follow each other. On the face of it, you could also say it is surprising that implied volatility consistently underestimates actual volatility. You would think that the activity of options traders and investors would be more frenetic than actual prices, but from this observation, you could make the reverse case.
Hi Andy, I’ve just gone through your helpful article about understanding the implied volatility of options. Little did I know that when you want to open an option position, one of the key metrics to look at is the implied volatility. I’m still a beginner in trading and I have found this post very educative and informative. Thanks for sharing this great knowledge with us and I’ll also be sharing this wonderful article too.
Hi Kokonata, I am glad you found the article helpful. Best regards, Andy
This is a very detailed and interesting post. I think that you have clearly explained what volatility is and how it is calculated.
Being able to calculate it based on previous data certainly is an excellent guide to how it might perform in the near future, as long as normality remains in the area, or world during the period.
While all trading is speculative it is good that we can at least estimate an ‘all things being equal’ position.
I knew nothing about trading prior to this, but your posts have been enlightening.
Hi Geoff and thanks for the comment. If I were to try to frame the main point of this article in words it doesn’t use . . . It is probably that getting a grip on how other traders and the market, in general, view the prospects for future volatility is key to positioning yourself to increase your chances of gain and reduce your chances or loss. And this is what the implied volatility data tells us.
But it is also interesting to note, as demonstrated by the tables that implied volatility systematically underestimates actual historical volatility.
That in itself is an interesting study. To look back at periods comparing implied volatility with historical volatility for the same underlying and remember what the market sentiments were at specific times. This sort of historical view of how implied volatility has or has not foretold actual volatility can give valuable insights into reading how current implied volatility might be reflected in actual volatility going forward.
Thanks again for the insightful comment
Best regards
Andy
I’m still new to investing and new to learning how this works and how to go about being successful. There’s so much information about the good side, the things that work but this is exactly what I needed to know about the other side of investing and how to avoid them. There’s a lot of mistakes to be made and not a lot of resources in what to do when it does go wrong.
Hi and thanks for the comment. I think the whole field of individual investing is easily overwhelming when you first approach it. So I think the best approach is to start in just one area and get comfortable with that and gain some experience and a track record of success. Success doesn’t necessarily mean short-term profit, managing risk well through major market down periods is also a measure of success and a hugely important one. There are two other short articles I would recommend. This article helps you set investing goals. This article will help you decide where and how to begin. Good luck, Andy
I actually invested money quite a few years ago through a broker. I was very naïve and knew nothing, although I tried my hardest to learn at the same time it was difficult and all my money was lost.
I now have a fear of brokers.
I have recently been considering investing in maybe say an up and coming tech company, especially how things have and are changing along with the markets.
This article has been enlightening, a great resource to refer back to again and again, this is a site worth bookmarking.
Thank You for Sharing.
Mitch
Hi Mitch and thanks for the comment.
I am very sorry to hear that you lost your whole position last time you invested. I would strongly recommend that you read up a bit on diversification. Jumping back into the stock market with just one position in one tech company sounds like a very risky approach. I think the long-term prospects for tech are still good but tech company valuations are massively high right now for a number of reasons. There are some signs that tech stocks are losing their sparkle. Tech companies that are deeply involved in research and development, particularly if they are still to launch their main products rely heavily on borrowed money and hence low interest rates to fund their operations. This means they a ultra sensitive to interest rate rises. This is some of what we have seen in the last weeks, because the 10-year Treasury has hit new recent highs. The rates themselves are still historically low but the markets don’t like the sudden spikes up. So institutions have been liquidating tech stock positions. That has pushed their prices down and the Nasdaq with it. Now that can mean there are buying opportunities if you are still in it for the long-term. But it may also mean that technology stocks are not going to be the ones leading the market.
I would recommend this article on steps to take before you invest, and this article on simple approaches to investing.
Good luck and best regards, Andy
As an ETF and stock investor I really enjoyed learning from your article.
I have not ventured into options yet, seeing them as a more active investment category. However on reading your article, and seeing all those mathematical concepts used again (I hadn’t seen these since decades ago at university), this has given me better foundational knowledge and confidence in understanding the variables behind option pricing. Especially implied volatility.
I really like how you broke down all the components and look forward to reading more of your content. Also this is so much more than “Bad Investment Advice” “and ways to avoid it” – this is about building up people’s financial literacy and you are doing a community service by doing this. Thank you
Hi and thanks for stopping by and leaving this very complimentary comment. I am glad you found the article informative. Best regards, Andy
Thank you sharing the information about the implied volatility. As a newbie with investing, I like to learn as much as I can so I can be successful and know what to expect. I will apply the list of how to read for implied volatility and will use the calculation that you provided. I will follow you on your social media, thanks again!
Hi and thanks for stopping by and commenting. I am glad that you found the article useful. Best regards, Andy
Hi Andy. Another great article. Current financial market is full of complex instruments and posts like these, clearly explaining beginning investors basics are extremely helpful. Im really impressed with your detailed walkthrough, I work in financial institution for few years and I still learned lot of interesting stuff. Investing in options is not easy and it relates to high risk, but understanding volatility gives bigger chance to profit in longer term. Reading your article will definitely make it easier to understand details of this complex topic.
Hi Cogito and thanks for the positive feedback. I am glad you found the article useful and informative. Best regards, Andy
Thank you so much for this in depth and enlightening article on understanding-implied-volatility-of-options. The truth is I must come back to re read and fully understand this important subject. I have recently started buying stocks on the easy equity platform. I am aware that I am not fully aware of what i am doing. So far it has been trial and error . Thank you for kick starting me on this important research I have to make.
Hi Bogadi and thanks for the comment. I just checked EasyEquities and I guess you are based in South Africa. It looks like your platform offers rand-based and dollar-based investments. If you are very new to this area and mixing dollar and rand-based investments I would suggest that at some point you read up on foreign exchange risk. Here is an article that deals with foreign exchange risk. Good luck and best regards, Andy