 Investing in the stock market can be rewarding, but making informed decisions requires a solid understanding of a company’s financial health. One of the best ways to evaluate a stock is by analyzing financial ratios. These ratios provide insights into a company’s profitability, liquidity, efficiency, and valuation. In this guide, we’ll walk through the step-by-step process of analyzing a stock using financial ratios, using a real-world example calculating the ratios from published financial statements.
In practice it is easier to find these ratios on financial information sites, or through your broker’s platform, but knowing how to calculate these from scratch gives you a better feel for what is going on. Also, sometimes the big boys and gals make mistakes. So it is good to be able to go back to basics and check the numbers yourself.
Step 1: Choose a Stock and Gather Financial Data
For this example, let’s analyze Apple Inc. (AAPL). To begin, you’ll need to find the company’s financial statements, which can be found in SEC filings (10-K and 10-Q reports) or on financial websites like Yahoo Finance, Morningstar, or the company’s investor relations page.
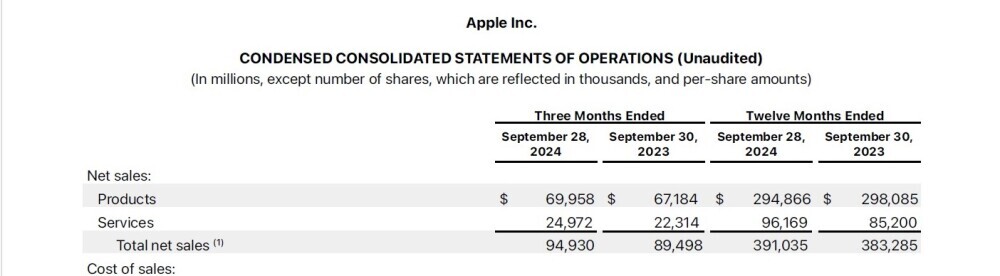
In this example we have downloaded from Apple Inc. investor relations page, the financial statements for the 3-month period and 12-month period ending 28 September 2024. The statements also show the 3-month and 12-month periods ending 30 September 2023 for comparison purposes. Let’s work with the 12-month, i.e. annual figures.
 Source: Apple Inc. Investor Relations.
The three key financial statements you’ll need are:
- Income Statement (for revenue, profit margins, and earnings data)
- Balance Sheet (for assets, liabilities, and shareholder equity)
- Cash Flow Statement (for operational, investing, and financing cash flows)
Step 2: Calculate Key Financial Ratios
1. Profitability Ratios
These ratios measure how efficiently a company generates profits.
 Source: Apple Inc. Investor Relations.
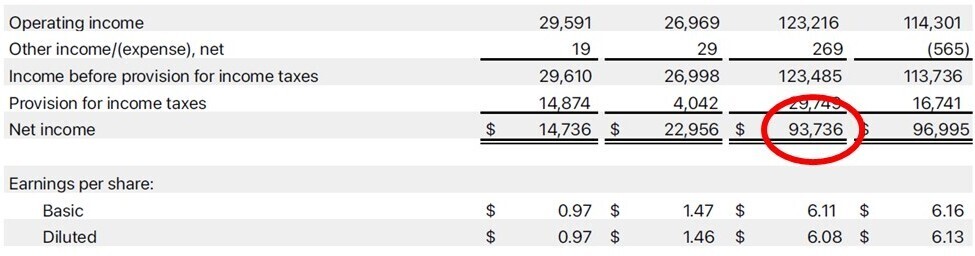
- Return on Equity (ROE) = Net Income / Shareholder’s Equity
-
- Measures how effectively a company uses shareholders’ equity to generate profits.
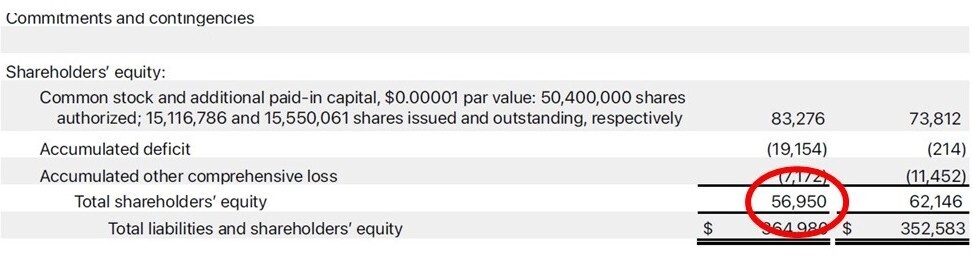
- For the 12-month period ended 28 September 2024 Apple had a net income of $93.736B and shareholder equity of $56.95B, ROE = 93.736/56.95 = 1.65 (or 165%).
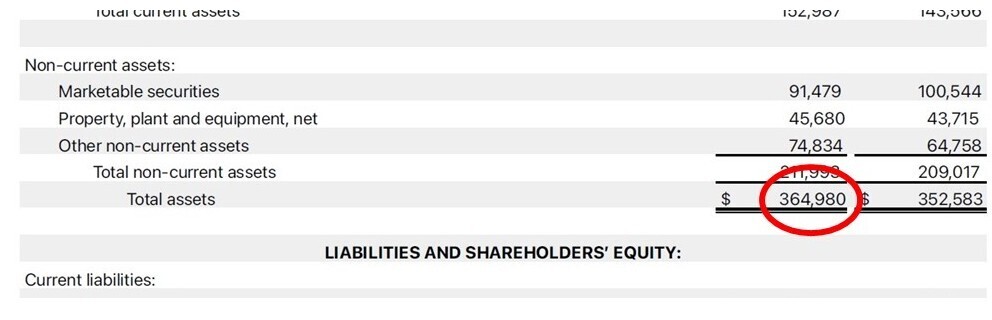
- Return on Assets (ROA) = Net Income / Total Assets
 Source: Apple Inc. Investor Relations.
2. Liquidity Ratios
Liquidity ratios assess a company’s ability to meet short-term obligations.
 Source: Apple Inc. Investor Relations.
- Current Ratio = Current Assets / Current Liabilities
-
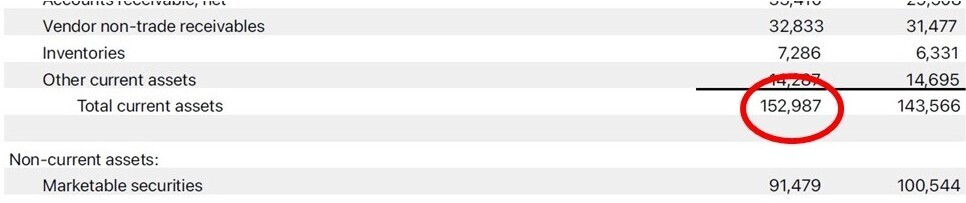
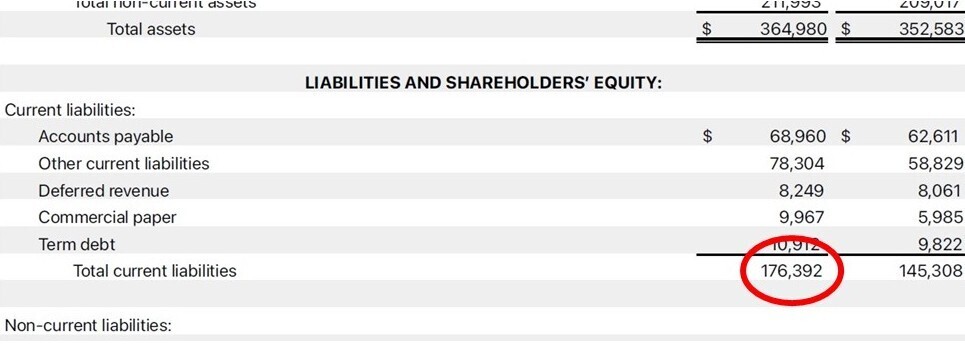
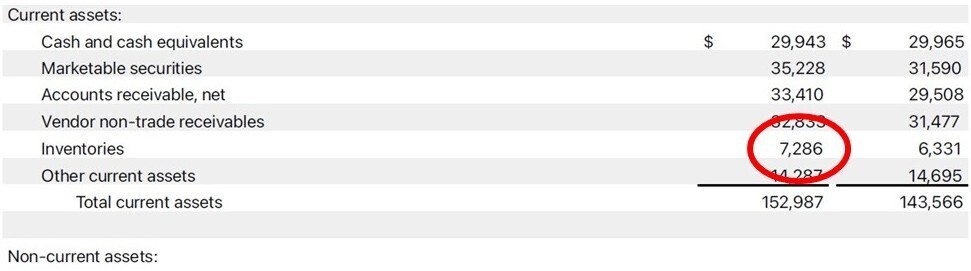
- For the 12-month period ended 28 September 2024 Apple had current assets of $152.987B and current liabilities of $176.392B, Current Ratio = 152.987/176.392 = 0.8673
- A ratio above 1.0 indicates the company can cover short-term debts. As this is somewhat lower than 1.0, we would probably want to check if this was a seasonal dip or a sign of a trend. At this stage let’s just not that the Current Ratio from the previous 12-month period was 0.9880, so not as bad.
- Quick Ratio = (Current Assets – Inventory) / Current Liabilities
-
- Similar to the current ratio but excludes inventory, as it may not be easily liquidated.
- Here Apple had $7.286B in inventory, Quick Ratio = (152.987 – 7.286)/176.392 = 0.8260.
 Source: Apple Inc. Investor Relations.
3. Valuation Ratios
Valuation ratios help determine whether a stock is fairly priced compared to its earnings and assets.
When we calculate the Price-to-Earnings (P/E) ratio we need to take the nearest market closing share price. Also, for fundamental analysis it is preferable to calculate the P/E ratio from the diluted Earnings Per Share (EPS) since that takes into account the impact of all potential diluters of equity.
 Source: Apple Inc. Investor Relations.
- Price-to-Earnings (P/E) Ratio = Stock Price / Earnings Per Share (EPS)
- Price-to-Book (P/B) Ratio = Stock Price / Book Value Per Share
-
- In this case we have to calculate the Book value per share. It is the same as the shareholder’s equity divided by the total shares. Shareholder equity on 28 September 2024 was $56.98B. The total number of shares was 15.408095 B. Apple’s book value per share was $56.98/15.48095 = $3.70,.
- P/B = 227.79/3.70 = 61.60.
- A high P/B ratio may indicate overvaluation, or it may reflect strong growth prospects.
4. Solvency Ratios
Solvency ratios indicate financial stability and long-term risk.
 Source: Apple Inc. Investor Relations.
- Debt-to-Equity Ratio = Total Debt / Shareholder’s Equity
-
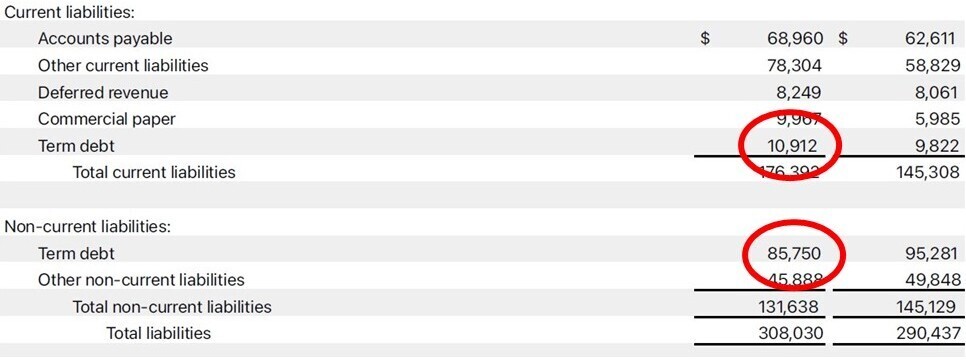
- From the statement we see Apple had $10.912B in short-term debt and $85.75B in long-term debt making a total debt of $96.662B and equity of $56.98B, Debt-to-Equity = 96.662/56.98= 1.70.
- A high ratio may indicate risk, but it depends on industry norms.
- Interest Coverage Ratio = EBIT / Interest Expense
-
- On 28 September 2024, Apple’s EBIT was $123.485B but it had no interest expense during the period we are looking at. In this case the Interest Coverage ratio is not meaningful, other than to say that Apple had no issue paying interest on its debt.
- A higher number means the company can easily meet interest obligations.
 Source: Apple Inc. Investor Relations.

Step 3: Compare Ratios with Industry Averages
Analyzing financial ratios in isolation isn’t enough—you need to compare them with industry peers. I used Etrade, but you can also find these benchmarks on Yahoo Finance, Morningstar or Bloomberg.
 Source: Etrade
- The average P/E ratio in the tech industry is 27.02, Apple’s P/E of 37.47 suggests it might be overvalued. But of course Apple Inc. enjoys a premium due to its leadership position in this industry. So this high P/E ratio is most likely a reflection of investor expectations of future earnings.
- If Apple’s ROE was 165%, but the industry average was 5.67%, it indicates very strong financial efficiency.
Step 4: Identify Red Flags and Investment Opportunities
Potential Red Flags:
There are many potential red flags you can see in financial ratios. If you spot anything that looks out of the ordinary, or far from the benchmark it will pay to dive deeper in and look for reasons why. Here are just a few potential red flags.
- Declining ROE or ROA over multiple quarters may indicate efficiency issues.
- A rising Debt-to-Equity Ratio could mean increasing financial risk.
- Unusually high P/E ratios may indicate an overvalued stock.
- Negative cash flow trends signal potential liquidity issues.
Investment Opportunities:
On the other hand, financial ratios that stand out from the industry benchmark can be a sign that the market has overlooked the company or under-estimated the future growth potential. Here are a few possible examples.
- Strong profitability ratios (high ROE and ROA) suggest a well-managed company.
- A low P/E ratio compared to industry peers may indicate an undervalued stock.
- A solid Current Ratio (above 1.0) means the company can handle short-term obligations.
Step 5: Use a Spreadsheet Template for Analysis
To streamline stock analysis, use a spreadsheet template to input key financial figures. Here’s a simple format:
 Source: Bad Investment Advice, Apple Inc. Investor Relations
 Conclusion
Financial ratio analysis is a powerful tool for evaluating a stock’s potential. By systematically gathering financial data, calculating key ratios, and comparing them to industry averages, investors can make informed decisions. Be mindful of red flags and consider multiple financial metrics before investing. Using a spreadsheet template can help track multiple stocks efficiently.
Next Steps:
- Download our free Stock Analysis Spreadsheet Template.
- Read more about Advanced Stock Screening Techniques.
By following these steps, you’ll be well-equipped to analyze any stock like a pro! Happy investing!
Affiliate Disclosure: This article contains affiliate links. If you click on a link and buy something, I may receive a commission. You will pay no more so please go ahead and feel free to make a purchase. Thank you!
It has often been said that there is no better investment than your own financial education. One great way to accelerate your financial education and your investing success is with the American Association of Individual Investors, the AAII. When you join the AAII, you get access to reports, courses on investing, risk management, asset allocation, retirement planning, managing retirement finances, and other resources, all for a single annual membership fee.
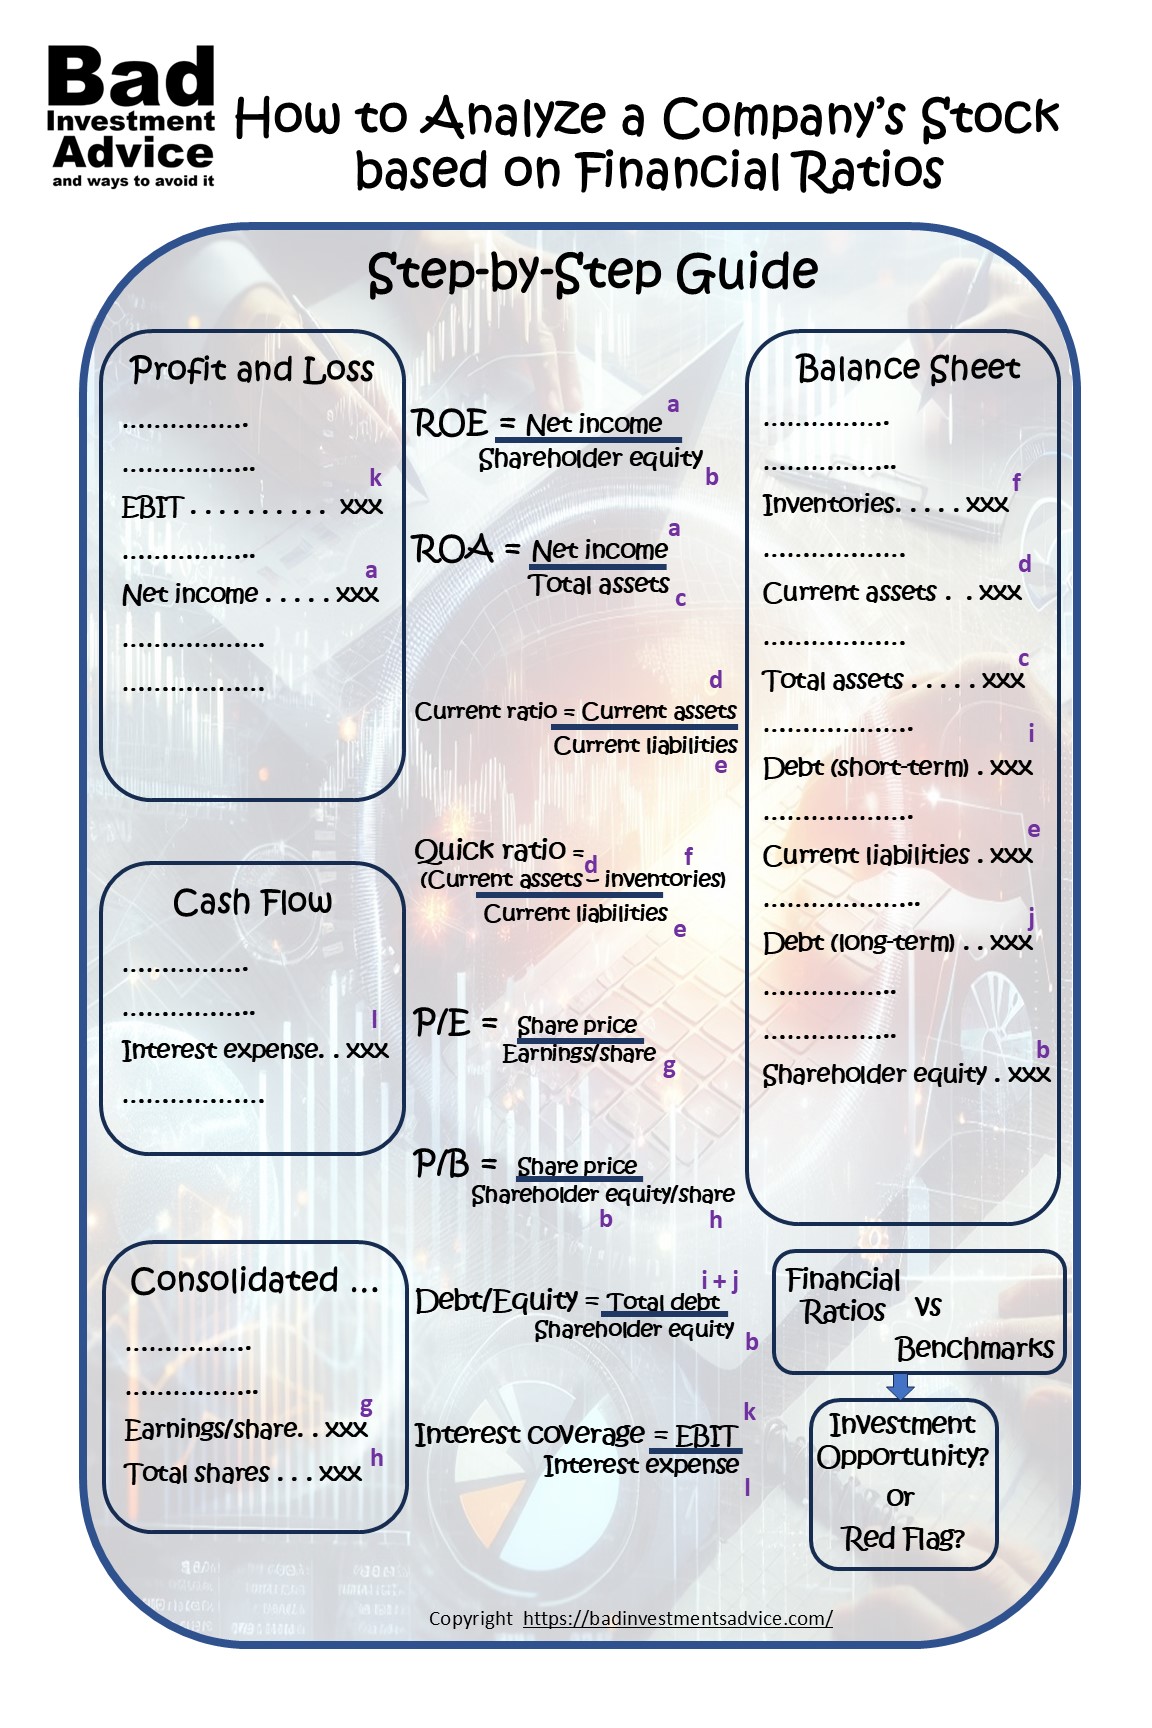
Single-page Summary
Here is a single-page summary of How to Analyze a Stock Using Financial Ratios: A Step by Step Guide. You can download a pdf here.
I hope you found this article interesting and useful. Do leave me a comment, a question, an opinion, or a suggestion and I will reply soonest. And if you are inclined to do me a favor, scroll down a bit and click on one of the social media buttons, and share it with your friends. They may just thank you for it.
You can also subscribe to email notifications. We will send you a short email when a new post is published.
Disclaimer: I am not a financial professional. All the information on this website and in this article is for information purposes only and should not be taken as personalized investment advice, good or bad. You should check with your financial advisor before making any investment decisions to ensure they are suitable for you.
Affiliate Disclosure: This article contains affiliate links. If you click on a link and buy something, I may receive a commission. You will pay no more so please go ahead and feel free to make a purchase. Thank you.