
Stock analysis is all about digging into the nitty-gritty details to figure out whether it’s worth putting your money into a company’s shares. Getting a handle on this process can really set you up for smart investing. Essentially, stock analysis involves looking at various factors that might impact a stock’s future performance, helping you make informed decisions rather than just winging it.
When it comes to how you analyze stocks, there are two main strategies: technical analysis and fundamental analysis.
Technical analysis is more an art than a science. You look at charts and historical data, paying attention to patterns and trends to guess what might happen next.
Fundamental analysis is more like being a research scientist. It involves checking out the company’s financial health, earnings reports, and market position. Each method has its fans and critics, but knowing both can give you a fuller picture.
Now, diving into the realm of financial metrics is important. You’ll hear about things like the
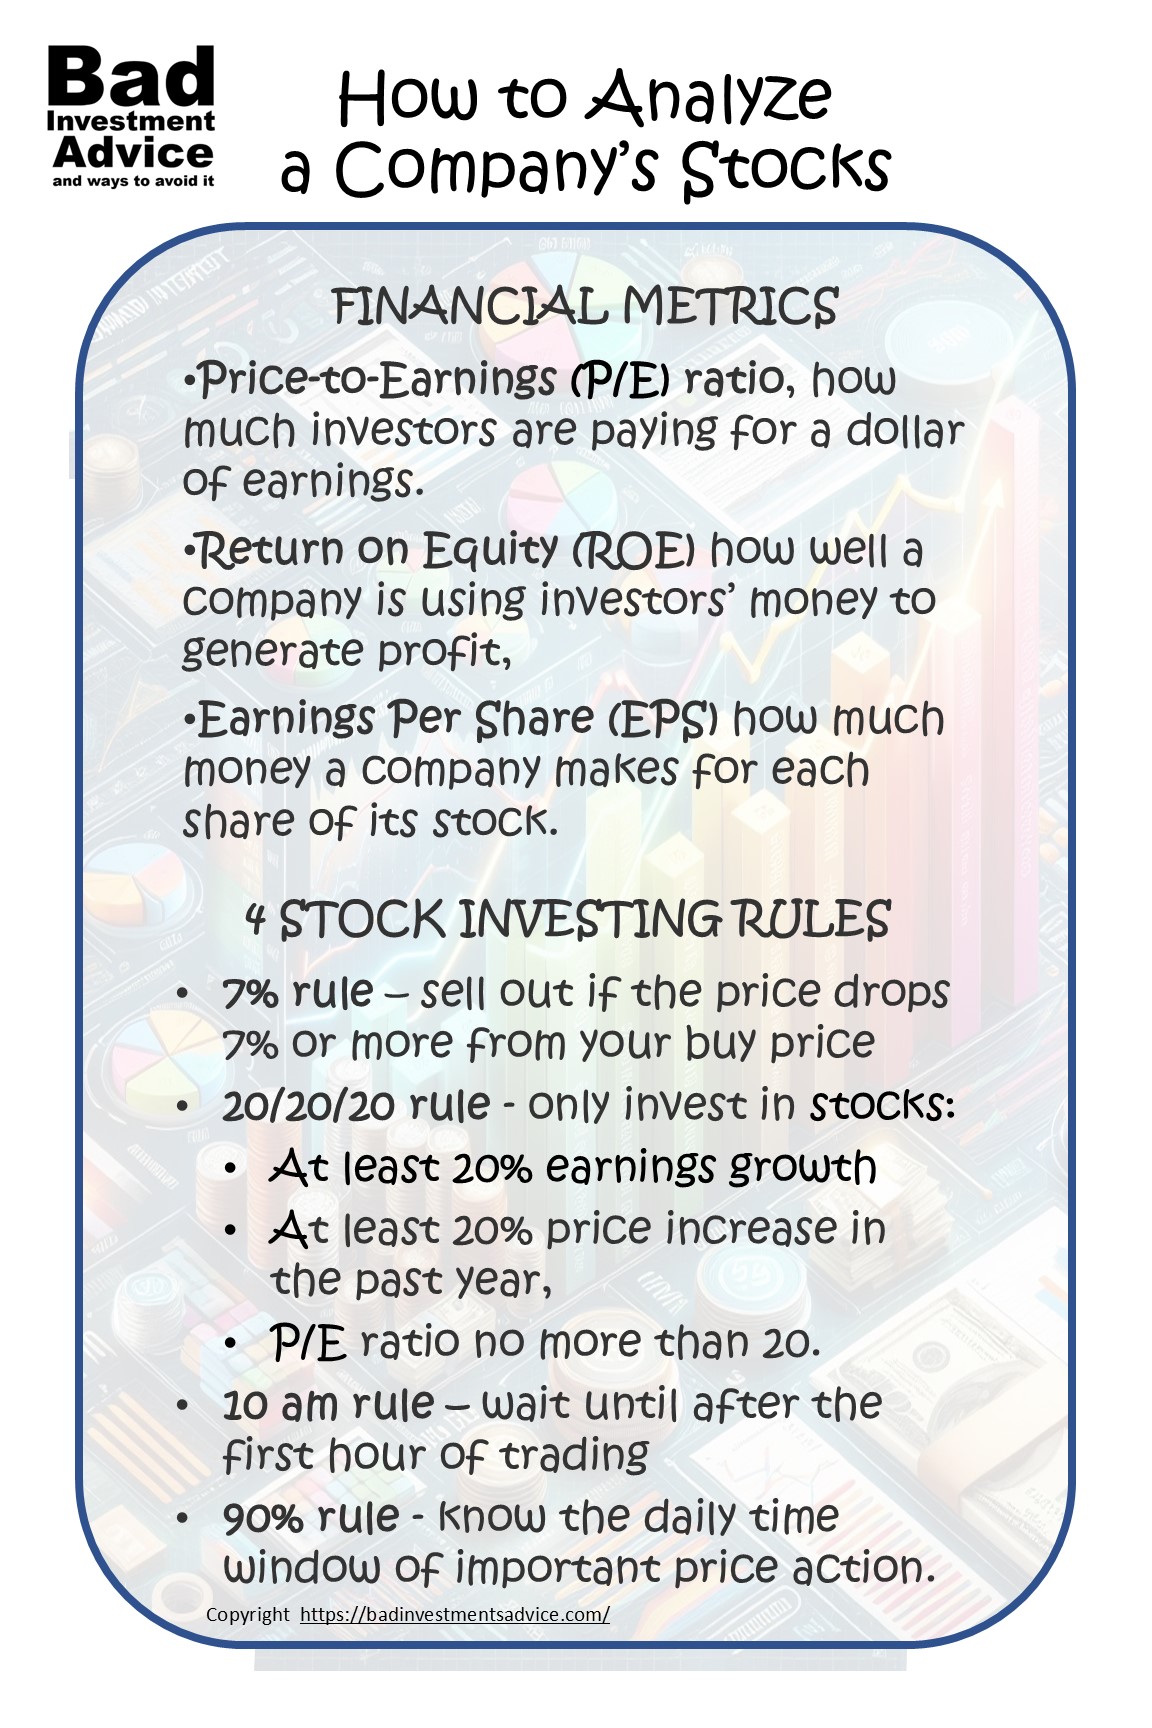
- Price-to-Earnings (P/E) ratio, which shows how much investors are paying for a dollar of earnings.
- Return on Equity (ROE) shows how well a company is using investors’ money to generate profit, while
- Earnings Per Share (EPS) tells you how much money a company makes for each share of its stock. Get cozy with these terms, as they’ll be your best friends in stock analysis.
Pay attention to market trends and economic indicators too. Things like the unemployment rate, consumer confidence, and interest rates can all push stocks up or down. Keeping an eye on these broader factors can give you context when you’re evaluating a stock. It’s a bit like doing your homework so you’re not caught off guard by unexpected market swings.

Exploring Essential Stock Market Rules
In the world of stock investing, there are a few key rules that can guide you to smarter decisions. Here are terms you will encounter.
- The 7% rule
- The 20/20/20 rule
- The 10am rule
- The 90% rule
These gems of wisdom often come from seasoned investors and market analysts who have seen it all. Knowing these rules can help you maneuver through the market chaos with a bit more ease. Alternatively, following these rules can also provide a sense of emotional security that if your investments do lose money, at least you followed expert advice so you should be in good company.
First off, there’s the 7% rule, which is a handy guide for cutting losses. If you’re holding onto a stock and its price drops by 7% or more from where you bought it, many advise selling it off to prevent further damage. It’s a way of saying, ‘Don’t let hope trump strategy.’ Letting go of a losing stock can sometimes save you from more significant losses down the road.
Next, the 20/20/20 rule is more about discipline than numbers. The idea here is to only invest in stocks that meet at least 20% in earnings growth, with a stock price showing a 20% minimum increase in the past year, and trading at a P/E ratio of no more than 20. This rule helps in filtering out underperformers and focusing on robust, growing companies. However, you will find that in a bull market stocks with a P/E ratio of 20 or less can be hard to find. A conservative investor could take that to mean it is time to move to the side lines, i.e. move more into cash. On the other hand an aggressive investor would say some of the biggest profits are to be had toward the peak of a bull market.
Then there’s the 10 am rule, which suggests that the first hour of trading can be quite volatile. Many investors prefer waiting it out a bit and making decisions after the market has had some time to settle and reveal reliable trends for the day. It’s like letting the dust settle before making your moves.
Finally, the 90% rule indicates that a high percentage of stock market gains on any given day often come within a concentrated timeframe. This insight can encourage investors to stay alert during key market hours and be ready to act when opportunities arise. Market timing can be tricky, but understanding when the true action takes place helps focus your attention where it matters most.
The Step-by-Step Process of Analyzing Stocks
Starting your journey into stock analysis involves digging into the background of the company you’re interested in. Learn about its history, what it sells, and what industry it operates in. Knowing this puts you in the driver’s seat. You’ll be making informed choices rather than guessing based on headlines or hype.
Next, take a closer look at the company’s financial health. Use key metrics like the balance sheet, income statement, and cash flow reports. Assessing these helps you see the company’s financial backbone—its strengths and gaps—and your knowledge of P/E, ROE, and EPS metrics will come in handy here. A financially healthy company is both solvent and liquid. It is also important to understand the solvency and liquidity of a company in the context of the industry in which it operates. Here is an article that looks into these aspects of financial health.
Once you have a grip on the basics, see how this company stacks up next to its rivals. So to judge a company’s financial health, compare these metrics with those of competing companies in the same industry. Comparing similar companies shows whether your pick is ahead of the pack or lagging behind. It puts performance into context, giving you a clearer perspective on whether it’s a leader or just keeping up with the crowd.
Growth prospects can be the tipping point. Investigate how poised a company is for the future. Look at its plans for innovation, market expansion, or diversification. This is vital, considering how fast the market shifts. Companies ready to leap forward usually have a roadmap that reflects ambitious yet achievable goals.
Practical Tips and Strategies for Stock Analysis
Diving into stock analysis doesn’t require a Wall Street pedigree. Practical tools and resources are out there to help you make informed decisions. Platforms like Yahoo Finance, Google Finance, and Bloomberg offer valuable insights and data you can use to analyze stocks. Setting up alerts for news and trends keeps you updated on any impactful news. Your brokerage platform will have many useful tools so do take the time to check them out.
Having a historical perspective on stocks can do wonders. Checking past performance over several years helps spot trends that might otherwise be missed. At the same time, throwing future predictions into the mix allows you to evaluate potential growth and challenges. Analysts’ forecasts and market predictions are tools that can help, but remember, they’re not foolproof.
Striking the right balance between logic and emotion is critical. Getting emotionally attached to a particular stock can cloud judgment. While it’s okay to trust your gut sometimes, backing up hunches with solid data is key. Developing a set of criteria for buying and selling will keep you consistent and level-headed.
Diversification is Key
Building a diversified investment portfolio reduces risk and increases potential returns. Don’t put all your eggs in one basket; spread investments across industries and asset types. Stick to a mix that aligns with your risk tolerance and investment goals. This strategy helps manage risk and taps into opportunities across sectors.
Affiliate Disclosure: This article contains affiliate links. If you click on a link and buy something, I may receive a commission. You will pay no more so please go ahead and feel free to make a purchase. Thank you!
It has often been said that there is no better investment than your own financial education. One great way to accelerate your financial education and your investing success is with the American Association of Individual Investors, the AAII. When you join the AAII, you get access to reports, courses on investing, risk management, asset allocation, retirement planning, managing retirement finances, and other resources, all for a single annual membership fee.
Single-page summary
Here is a single-page summary of how to analyze a company’s stocks. You can download a pdf here.
I hope you found this article interesting and useful. Do leave me a comment, a question, an opinion, or a suggestion and I will reply soonest. And if you are inclined to do me a favor, scroll down a bit and click on one of the social media buttons, and share it with your friends. They may just thank you for it.
You can also subscribe to email notifications. We will send you a short email when a new post is published.
Disclaimer: I am not a financial professional. All the information on this website and in this article is for information purposes only and should not be taken as personalized investment advice, good or bad. You should check with your financial advisor before making any investment decisions to ensure they are suitable for you.
Affiliate Disclosure: This article contains affiliate links. If you click on a link and buy something, I may receive a commission. You will pay no more so please go ahead and feel free to make a purchase. Thank you
This is a great breakdown of stock analysis, covering both technical and fundamental approaches! I’m curious—how do you personally balance these two methods in your own investing strategy? Also, among the stock market rules mentioned (7% rule, 20/20/20 rule, etc.), which one do you think is the most crucial for beginners to follow?
Hi and thanks for the question. My personal take on fundamental analysis vs technical analysis is that a great deal depends on your investing horizon. The longer your horizon is the more relevant fundamental analysis becomes, whereas a short-term or particularly a day trader can mostly ignore fundamentals if the technical price action is so compelling. The reason fundamental analysis is more important over the long-term is because fundamentals eventually show up in the stock price because good fundamentals return profits which a company will either return as dividends or stock buy-backs or other strategic investments. My personal investing style is long-term. I would say a similar time horizon consideration applies to people starting out investing. If you are short-term investing then the rules are important and I would say the 7% rule is most important to get you out of a losing position. If you are a long-term investor then the 20/20/20 rule makes most sense, though you would be better off conducting much more analysis that is involved in just the 20/20/20 rule. So that would be my take. Thanks again for a great question.
Excellent tidbits of advice when investing in stocks. It is definitely an art and science! One can “wing it” and get mediocre results. But with a little research and some calculated, stocks can be rewarding. This brings me to a question:
When doing technical analysis, what are some reliable sources for charts and historical data you use?
Hi and thanks for the comments and question. In most cases your brokers platform should certainly provide price charts using historical data going back many years. If you are looking to download raw historical stock price data then Yahoo finance is an excellent source.
Much of this is way over my head, so the way you simplify things is terrific. I also think your infographics are brilliant!
Thanks for stopping by. I can’t help thinking though that if it feels over your head then I still have work to do.