 Imagine you’re at a dinner party, and the conversation shifts to personal finance. Someone poses a question: “If you start with $1,000 and add $100 each month into an investment account with a 5% annual interest rate, how much will you have in 10, 20, or 30 years?”
While this might seem like a straightforward math problem, it delves into the profound effects of compound interest and the impact of consistent investing over time. Let’s explore this intriguing puzzle to uncover the secrets of compounding and strategic financial planning.
The Investing Puzzle Challenge
Before diving into the solution, let’s lay out the challenge:
The Puzzle:
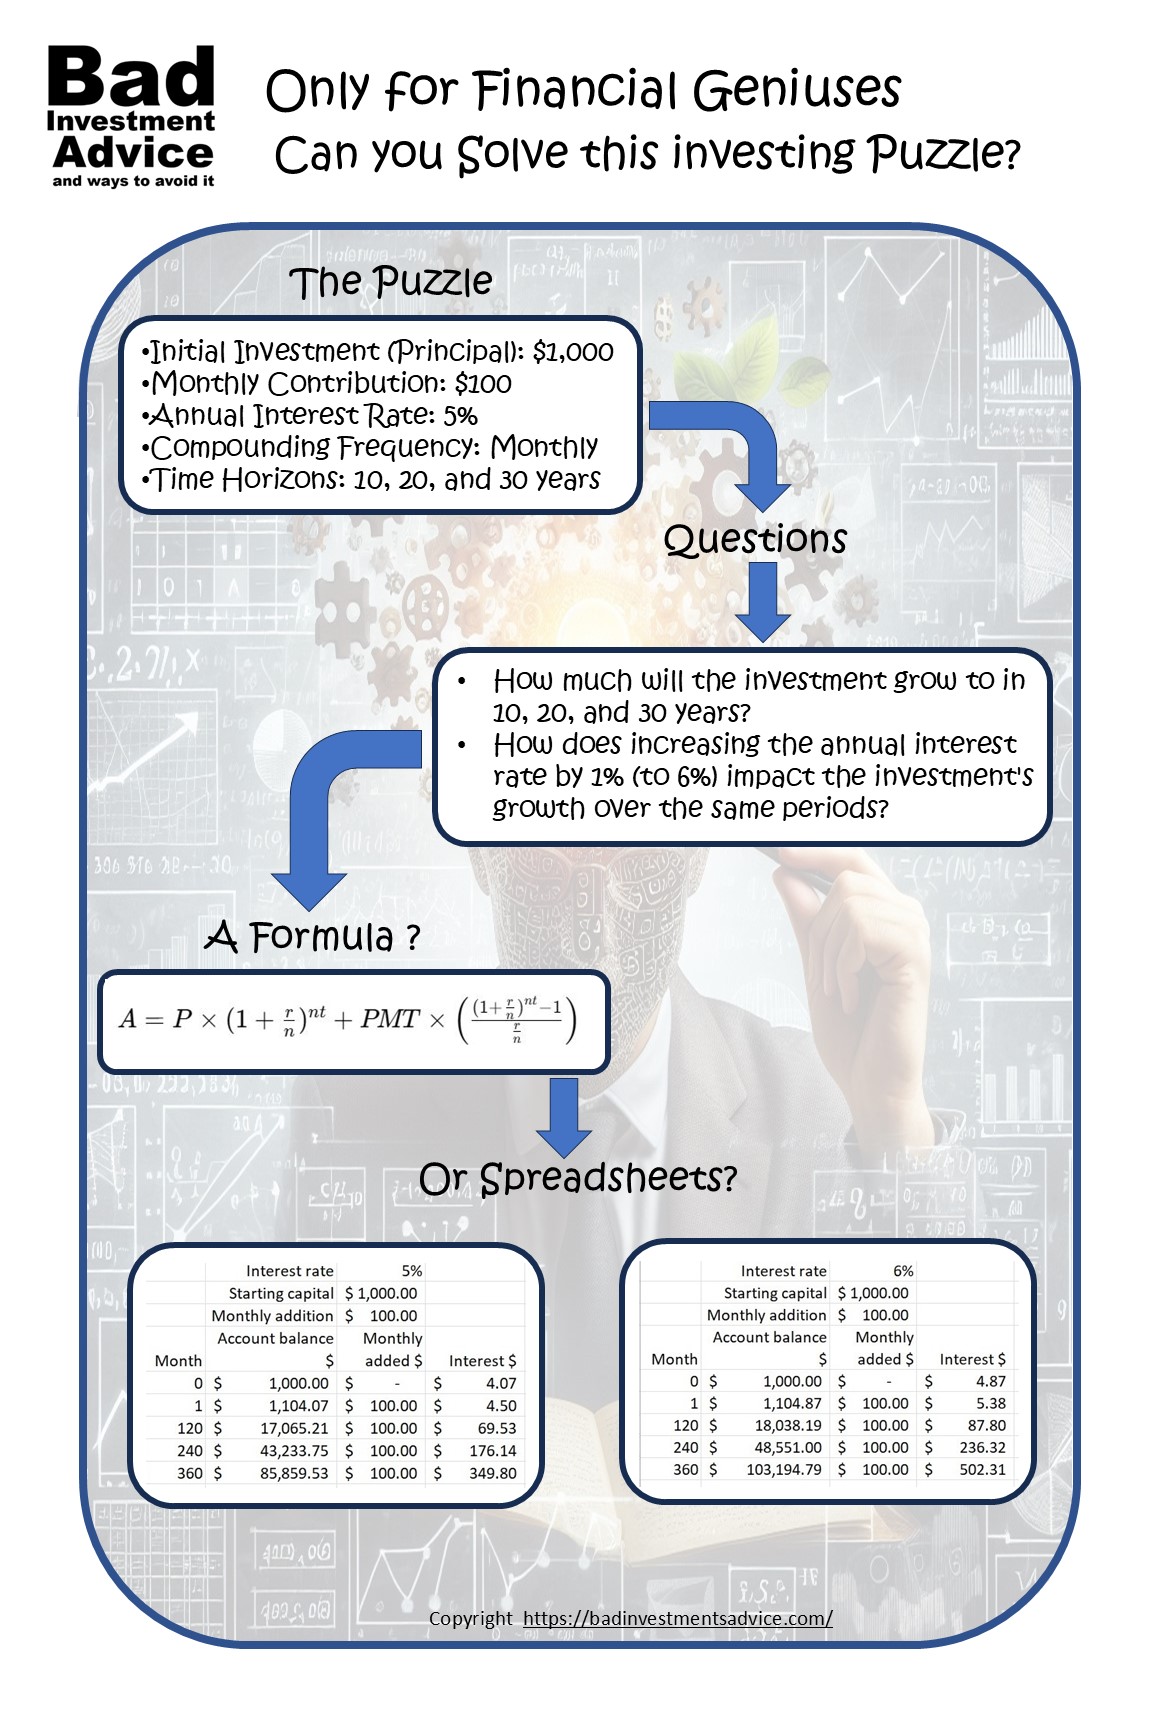
- Initial Investment (Principal): $1,000
- Monthly Contribution: $100
- Annual Interest Rate: 5%
- Compounding Frequency: Monthly
- Time Horizons: 10, 20, and 30 years
Questions:
- How much will the investment grow to in 10, 20, and 30 years?
- How does increasing the annual interest rate by 1% (to 6%) impact the investment’s growth over the same periods?
Take a moment to ponder these questions. Grab a calculator or a pen and paper, and see if you can solve this puzzle before reading on.
The Power of Compounding
Understanding Compound Interest with Regular Contributions
Compound interest is the process where the interest earned on an investment is reinvested, generating additional earnings over time. When combined with regular contributions, the growth becomes even more significant. For the mathematically inclined the formula to calculate the future value of an investment with regular monthly contributions, or at least a close approximation to it is:
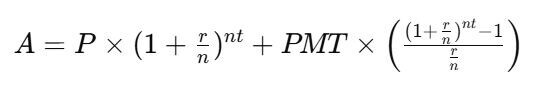 Where:
- A = the future value of the investment
- P = the principal investment amount (initial deposit)
- PMT = the monthly contribution
- r = the annual interest rate (decimal)
- n = the number of times interest is compounded per year
- t = the number of years the money is invested
Have your eyes glazed over yet? Mine have. I would never tackle a problem like this with a pen and paper or just a calculator and a formula unless I wanted to give myself a migraine. This is the sort of problem that is much easier to solve with a spreadsheet rather than a calculator. So, let’s use Microsoft Excel.

Plugging the puzzle into Excel
A spreadsheet is the perfect way to map out and solve this problem. It allows you to break it down into simple steps and you can easily see that you are on the right track. It is also a way to simulate how a bank or savings institution would handle your account in the real world. We can set up a spreadsheet to show what your account balance would be on a month by month basis.
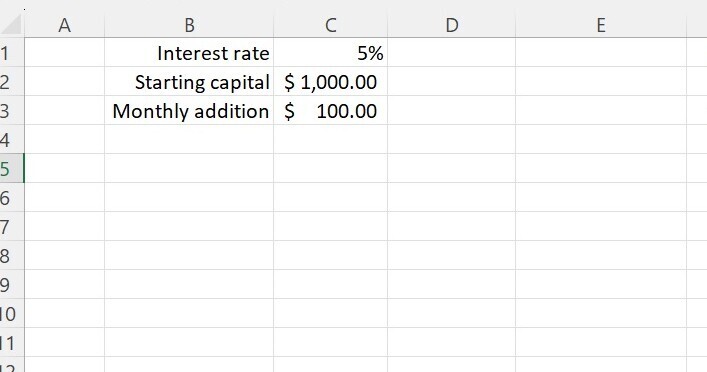
In this case we would set up a few variables that we could then change in later iterations to look at “what ifs” by easily changing the variables. Let’s isolate these variables:
- The interest rate
- The starting capital
- The monthly sum added
Then let’s set up the rows on the spreadsheet to represent successive months and capture sums in separate columns. It will make for a very big spreadsheet since we want to see what happens over 30 years, so we will need 360 rows, but that is what spreadsheets are good at. Also, once we have set up the sheet, we can hide any rows or columns we don’t want to see and just focus on the data we do want to see.
First let’s set up a little block at the top showing our three variables and label them.
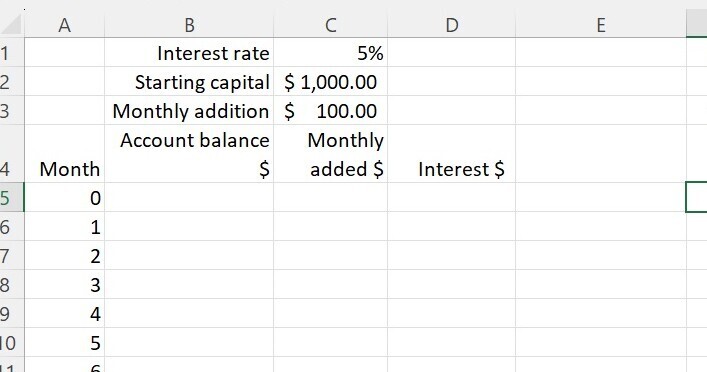
Then we add some column headings and number the months down the first column. Since we want to start with a capital sum, we start from month 0.
Then we copy the starting capital into the first cell under Account balance. And we calculate the monthly interest.
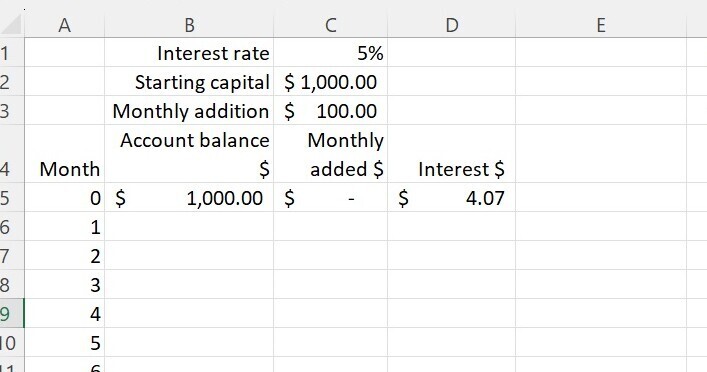 Calculation of the first month’s interest is a bit complicated. Because 5% is the annual interest rate, we need to calculate the monthly interest rate which is a 1/12th power of the annual rate. Actually, not quite. We need to calculate the 1/12th power by adding one first then subtracting at the end. Let’s not get too deeply into this, but in case anyone wants to see it, this is what it looks like in Excel using the POWER function.
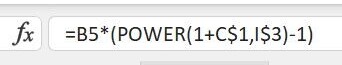 Just quickly then, B5 is the cell that has the account balance on which we need to calculate the interest, C1 is the cell that has the interest rate and we set up cell I3, off to the right to be 1 divided by 12. Since we intend to copy this formula down the columns, we need to make the row references absolute, hence the $ signs, but we can leave the column references relative.
The beauty of working with Excel in this way is that even if we don’t fully grasp the math, we can test to see that our sheet is working by changing a variable. Let’s say, we just started off with $1000 and we didn’t add any cash each month. If the annual interest rate is 5%, we would expect to have earned $50 interest at the end of the first year. So, let’s change the monthly sum added to $0 and this is what we get.
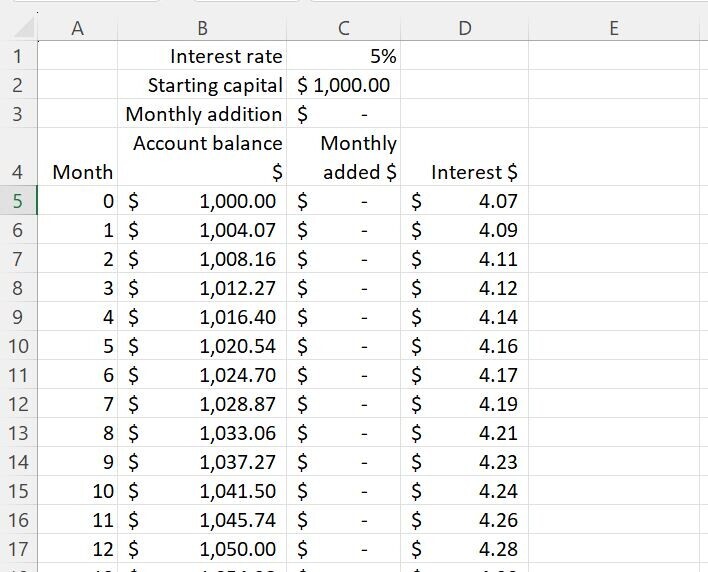 So it works! After 12 months we have an account balance of $1,050 exactly what we expected.
Back to our puzzle, we restore our monthly added sum to $100 and we copy down the three columns, Account balance, Monthly added, and Interest and this is what we get.
 Now since we only want to see what happens after 10 years, 20 years and 30 years, we hide all the rows in between and only leave visible the rows for months 0 and 1 to be sure we are not introducing any errors, then months 120, 240 and 360 corresponding with the end of year 10, 20 and 30 respectively.
 And there is our first answer. If we start with $1, 000, add $100 per month and invest it all at 5% annually we would have:
- $17,065 after 10 years
- $43,233 after 20 years
- $85,859 after 30 years,
That’s not bad. What about if we invest at an interest rate of 6% annually. This is what we get.
 So, we have our second answer. If we start with $1, 000, add $100 per month and invest it all at 6% annually we would have:
- $18,038 after 10 years
- $48,551 after 20 years
- $103,194 after 30 years,
 Insights from the Calculations
Our calculations highlight the exponential growth potential of compound interest, especially when combined with regular contributions. Notably:
- Time Horizon: The longer the investment period, the more pronounced the effects of compounding. For instance, at a 5% interest rate, the investment grows from approximately $17,065 in 10 years to $85,859 in 30 years.
- Interest Rate: A modest increase in the interest rate significantly impacts the investment’s growth. Comparing the 5% and 6% scenarios over 30 years, the future value increases from approximately $85,858 to $103,194—a difference of $17,335.
Strategic Approaches to Financial Problems
Setting Clear Financial Goals
Establishing specific, measurable, achievable, relevant, and time-bound (SMART) financial goals is crucial for effective financial planning. Clear objectives provide direction and motivation, enabling you to tailor your investment strategies accordingly.
Understanding the Impact of Time on Investments
Time is a powerful ally in investing. The earlier you start, the more you benefit from compound interest. As demonstrated, extending the investment period from 10 to 30 years can exponentially increase the future value, emphasizing the importance of starting early.
Evaluating Risks and Potential Returns
Every investment carries inherent risks and potential returns. Assessing your risk tolerance and aligning your investment choices accordingly is essential. Diversifying your portfolio across various asset classes can help mitigate risks while aiming for favorable returns.
Continuous Learning and Staying Informed
The financial landscape is dynamic, with evolving markets, regulations, and investment vehicles. Committing to continuous learning ensures you stay informed about new opportunities and potential pitfalls, enabling you to make well-informed decisions.
Conclusion
The investing puzzle we explored underscores the profound impact of compound interest and the importance of strategic financial planning.
Here’s another article that looks at the variability of returns on the stock market over different 30-year periods. For the long-term investor, the news is good.
Affiliate Disclosure: This article contains affiliate links. If you click on a link and buy something, I may receive a commission. You will pay no more so please go ahead and feel free to make a purchase. Thank you!
It has often been said that there is no better investment than your own financial education. One great way to accelerate your financial education and your investing success is with the American Association of Individual Investors, the AAII. When you join the AAII, you get access to reports, courses on investing, risk management, asset allocation, retirement planning, managing retirement finances, and other resources, all for a single annual membership fee.
Single-page Summary
Here is a single-page summary of Only for Financial Geniuses. You can download a pdf here.
I hope you found this article interesting and useful. Do leave me a comment, a question, an opinion, or a suggestion and I will reply soonest. And if you are inclined to do me a favor, scroll down a bit and click on one of the social media buttons, and share it with your friends. They may just thank you for it.
You can also subscribe to email notifications. We will send you a short email when a new post is published.
Disclaimer: I am not a financial professional. All the information on this website and in this article is for information purposes only and should not be taken as personalized investment advice, good or bad. You should check with your financial advisor before making any investment decisions to ensure they are suitable for you.
Affiliate Disclosure: This article contains affiliate links. If you click on a link and buy something, I may receive a commission. You will pay no more so please go ahead and feel free to make a purchase. Thank you.
This article turns a classic compound interest problem into an engaging investing puzzle. It breaks down how starting with $1,000 and adding $100 every month at a 5% or 6% annual rate can grow your investment dramatically over 10, 20, and 30 years. I love how it demystifies the math using Excel, making it accessible—even if you’re not a number cruncher. It really makes you rethink the power of regular contributions and the long-term impact of even a small change in interest rate. Have you ever set up a spreadsheet to play around with your own investment projections?
Hi and thanks for the positive feedback and the question. I always use spreadsheets to track my investments including analyzing their performance including their performance relative to stock market indices over the same time period. For me it is always essential to know whether I would be better off just putting money into an indexed fund rather than individual stocks. Thanks again for the question. Andy